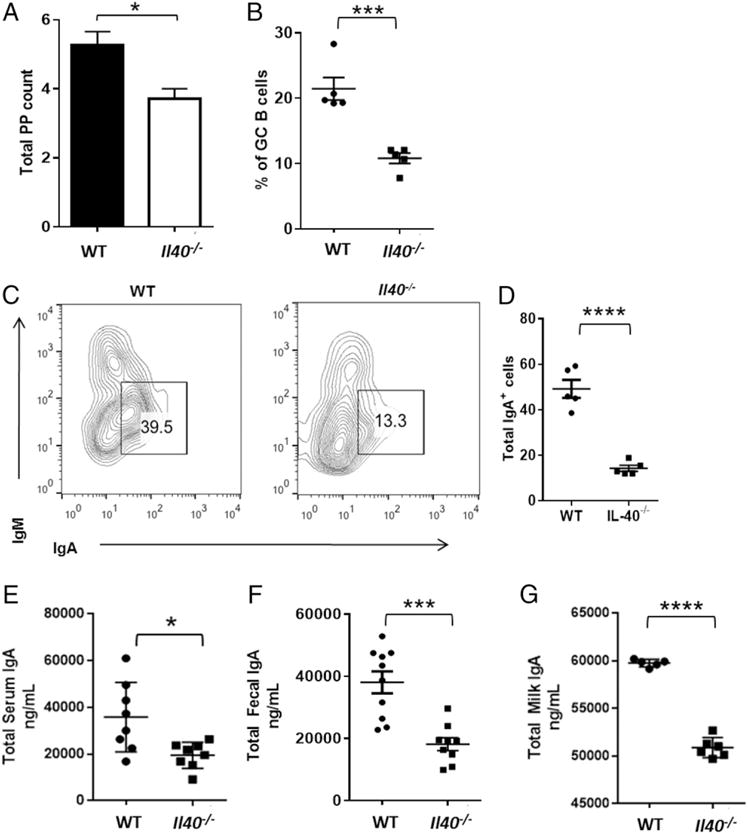
FIGURE 6.

Il40−/− mice exhibit defects in GALT B cell populations. (A) Total counts of PPs from WT or Il40−/− mice (mean ± SEM; n = 7). *p < 0.0102. (B) Percentage of cells representing germinal center B cells in PPs of (A). (C) Flow cytometry analysis of germinal center B cells from PPs showing lower numbers of IgA+ B cells. (D) Total number of IgA+ cells from (B) (× 10−5). ****p < 0.01. (E) Serum IgA levels in Il40−/− mice compared with WT controls, as measured by sandwich ELISA (mean ± SEM; n = 8). *p < 0.0114. (F) Measurements of total IgA in fecal pellets by sandwich ELISA of WT versus Il40−/− mice (mean ± SEM; n = 10). ***p < 0.006. (G) Measurement of total IgA in breast milk by sandwich ELISA of WT (n = 5) versus Il40−/− mice (n = 6) (mean ± SEM). ****p < 0.0001. Results shown are representative of three independent experiments, each performed with five mice per group.
