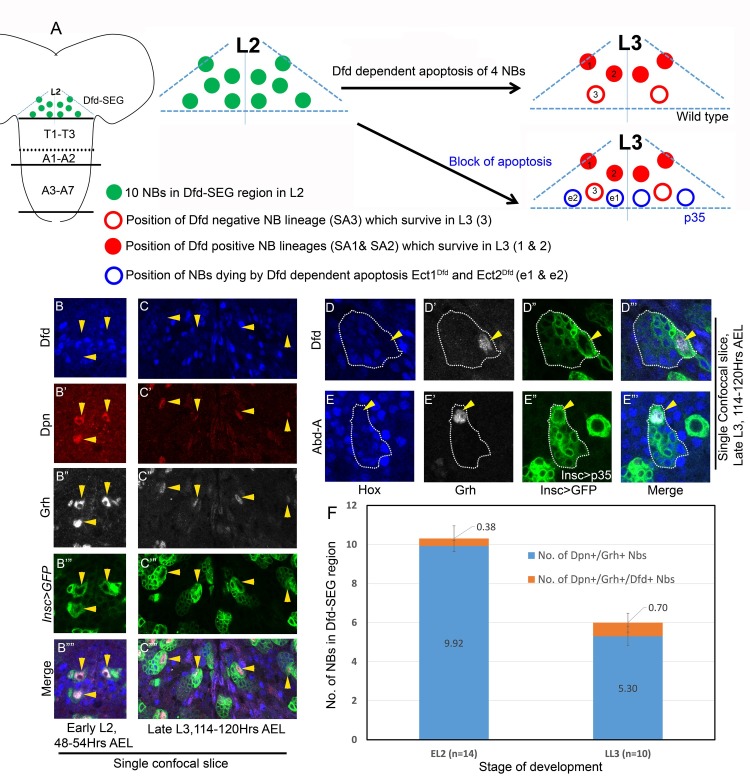
Fig 4. Hox-Grh expression code in pNBs and progeny is same for Dfd-SEG and abdominal segments.
(A) Schematic of L2 VNC showing the extent of Dfd-SEG region as seen by Dfd staining in vivo. Ten pNBs in L2 stage is shown as green filled circles. Approximate location of six pNBs surviving in L3 stage are shown as four filled red circles (showing SA1 and SA2 lineages indicated as 1 and 2) and two hollow red circles (representing SA3 lineage indicated as 3). Approximate location of four ectopic lineages when death is blocked by p35 expression from L1 are shown by hollow blue circles (ect1Dfd and ect2Dfd are indicated as e1 and e2) (B-C) Show that pNB in Dfd-SEG region of early L2 and late L3 larval VNCs express Grh. (D-E) Shows that Hox-Grh code of the pNB (Hox-/Grh+) and progeny (Hox+/Grh-) is same in abdominal and Dfd-SEG region. GFP marked lineage is enclosed by a dotted line. Biggest cell in the entire lineage is pNB which is Grh+, smaller cells are progeny neurons which are Hox+ and Grh-. pNB death in abdominal segments is blocked by gal80ts; inscGAL4 driven UAS-p35 expression specifically in larval stages. (F) Plot shows that all the pNB marked by Dpn in EL2 (10) and LL3 (6) are Grh+. Small “n” indicates number of larval VNCs counted. All larval VNCs expressed inscGAL4 driven UAS-mCD8-GFP from embryonic stages. Yellow arrowheads indicate pNBs. Average values are shown in middle of bars. Error bars indicate standard deviation.

