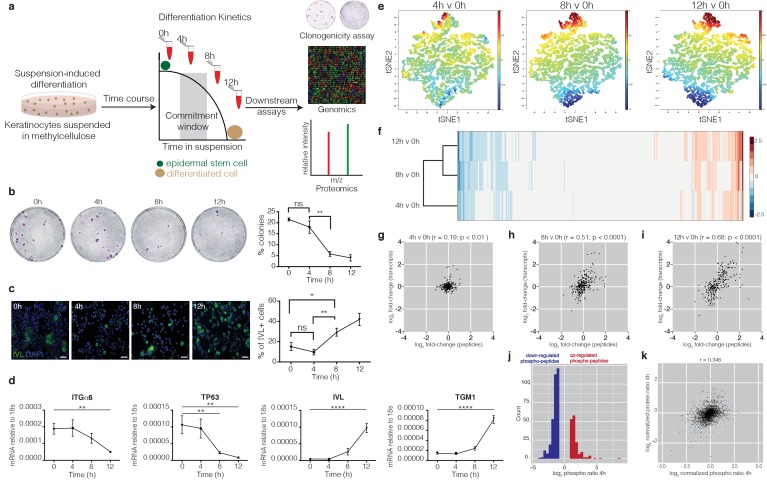
Figure 1. Genomic and proteomic analysis identifies protein dephosphorylation events that correlate with commitment.
(a) Schematic of experimental design. (b) Colony formation by cells harvested from suspension at different times. Representative dishes are shown together with % colony formation (n = 2 independent experiments, n = 3 dishes per condition per experiment; p-values calculated by Tukey’s multiple comparison test). (c) Cells isolated from suspension at different time points were labelled with anti-involucrin (IVL) antibody (green) and DAPI as nuclear counterstain (blue). IVL-positive cells were counted using ImageJ (n = 3 independent cultures; more than 300 cells counted per condition. p-value calculated by two-tailed t-test). Scale bars: 50 μm (d) RT-qPCR quantification of ITGα6, TP63, IVL and TGM1 mRNA levels (relative to 18 s expression) (n = 3 independent cultures). (e) t-SNE plot of genome-wide transcript expression by keratinocytes placed in suspension for different times. The t-SNE algorithm takes a set of points in a high-dimensional space and finds a faithful representation of those points in a lower-dimensional space, typically the 2D plane. (f) Heatmap representing hierarchical clustering of differentially expressed proteins (p<0.05). (g–i) Dot plots correlating expression of significantly differentially expressed peptides (p<0.05) that change twofold relative to 0 hr in at least one of the time points, with their corresponding differentially expressed transcripts. Pearson correlations (r) are indicated. (j) Histogram of normalised SILAC ratios corresponding to high confidence phosphorylation sites that differ between 0 and 4 hr. (k) Scatter plot correlating log2 normalised SILAC ratios for total protein changes (y-axis) with log2 phospho-peptide ratios (x-axis) between 0 and 4 hr. (b, c) *p<0.05; **p<0.01; ns = non-significant).


