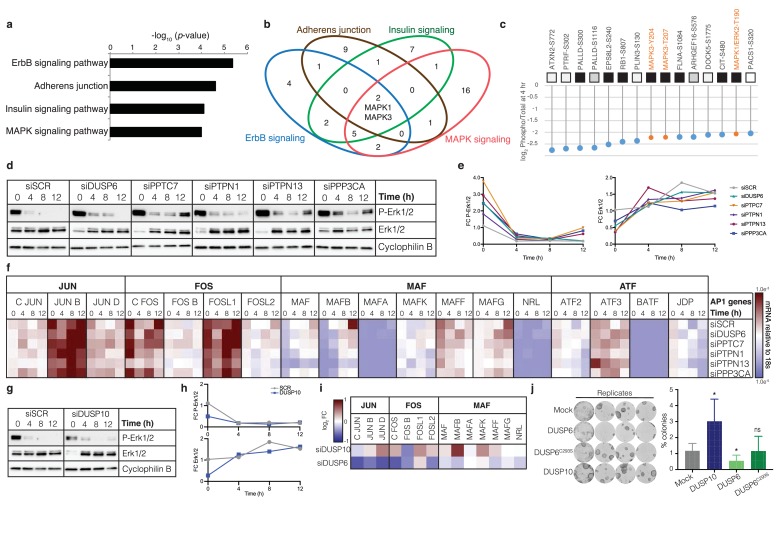
Figure 3. Pro-commitment phosphatases regulate MAPK signalling and AP1 transcription factors.
(a) Gene Ontology (GO) term enrichment analysis of ranked peptides dephosphorylated at 4 hr. (b) Venn diagram showing intersection of signalling pathways regulated at 4 hr. (c) Top 15 dephosphorylated peptide sites at 4 hr, showing ratio between change in phospho-peptides and change in total protein. Highlighted in orange are phosphorylations on MAPKs. (d, e) Representative western blot (d) and quantification (e) showing phospho-ERK1/2 and total ERK1/2 in cells harvested after 0, 4, 8 and 12 hr in suspension. Cyclophilin B: loading control. (f) Heatmap represents mRNA expression (relative to 18 s RNA) of AP1 transcription factor superfamily members during suspension-induced differentiation post-phosphatase knockdown (n = 3; values plotted are means of three independent transfections). See Supplementary file 6 for p-values generated by two-way ANOVA. (g–h) Representative western blot, with quantitation, of phospho-ERK1/2 and total ERK1/2 in suspended cells following DUSP10 knockdown. siSCR and loading controls are shown. (i) Heatmap showing mRNA expression (relative to 18 s mRNA) of JUN, FOS and MAF family members after DUSP6 and DUSP10 knockdown (values plotted are means of three independent transfections normalised against scrambled control; see Supplementary file 7 for p-values generated by two-way ANOVA). (j) Clonal growth (representative dishes and quantification) following doxycycline-induced over-expression of DUSP10, DUSP6 and mutant DUSP6C293S in primary keratinocytes (n = 3 independent cultures). p-values were calculated using one-way ANOVA with Dunn's multiple comparisons test (*p<0.05; ns = non significant).


