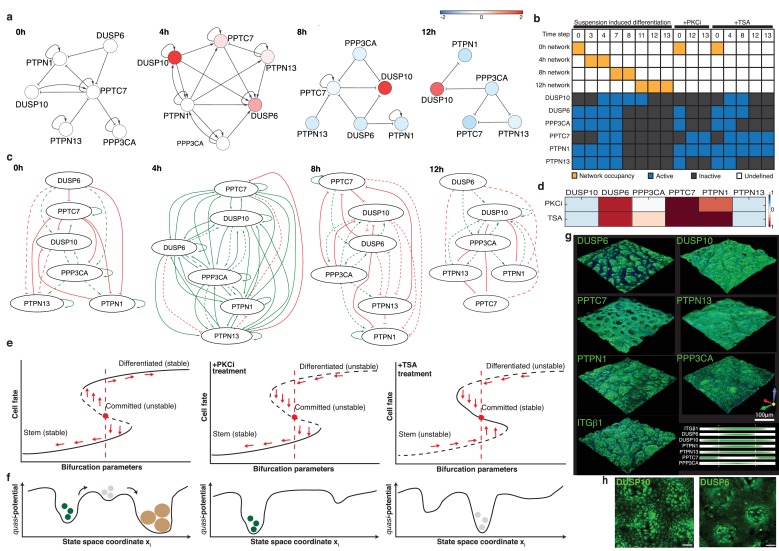
Figure 4. An autoregulatory network of phosphatases controls commitment.
(a) Colours represent log2 fold-change in phosphatase mRNA expression relative to 0 hr (values plotted are means of three independent experiments normalised against siSCR control). (b) Experimental observations that are encoded as constraints on the Boolean network trajectories. We defined three experimental constraints (gene expression changes during suspension-induced differentiation in the absence of pharmacological inhibitors, as well as under TSA and PKCi treatments). Each constraint encodes discrete gene expression states at the indicated time steps. For cells in the absence of drugs we imposed a switching scheme, whereby the system must change the representative network in order to achieve the expression constraints. Yellow boxes indicate the network that represents the system at that step; blank boxes for a given step (column) indicate that we did not impose a specific network, so the system can remain in the current network or switch forwards. Active means the gene is considered to be ‘on’ at that step, inactive means to be ‘off’ at that step. The discretisation is available in Supplementary file 9. (c) Networks able to satisfy the model constraints of the Boolean formalism in (b) are depicted. Solid lines show interactions already calculated in (a), while dashed lines are possible interactions inferred from Figure 4—figure supplement 1. See also Supplementary file 8 and 9. (d) Heatmap represents mRNA expression (relative to 18 s mRNA) of individual phosphatases in cells treated in suspension for 12 hr with PKCi or TSA (values plotted are the means of three independent experiments normalised against vehicle-treated control). (e, f) Representation of commitment as two saddle-node bifurcations in a direction xi of the state space for control cells or cells treated with PKCi or TSA. In the control both stem and differentiated cell states are stable (attractors), while commitment is an unstable state. Since the 0 hr network is able to reach the expression constraint for PKCi at 12 hr, we hypothesise that on PKCi treatment, the only stable state is the stem state. On TSA treatment there is a mandatory switch from the 0 hr network but the 12 hr network cannot be reached at any time point; we therefore hypothesise that commitment becomes a stable state while the stem and differentiated cell states are unstable. (g) 3D-volume rendered confocal images of wholemounts of human epidermis labelled with antibodies against commitment phosphatases or ITGβ1 (green) and counterstained with DAPI (blue). The distribution of each phosphatase relative to ITGβ1 is also shown graphically. (h) 3D-volume rendered confocal images of primary keratinocytes cultured on PDMS topographic substrates and labelled with antibodies to DUSP10 and DUSP6. Scale bars: 100 μm.


