. 2017 Oct 24;6:e29428. doi: 10.7554/eLife.29428

Figure 6. Effect of AMPylation on J domain-stimulated ATPase activity of BiP and ADP release from BiP.

(A) Shown is an autoradiograph of 32P-labeled ATP and ADP separated by thin-layer chromatography, the products of a single-turnover ATPase assay to analyze the effect of AMPylation on ATP hydrolysis by BiP. Pre-formed complexes between purified unmodified or AMPylated wildtype BiP protein and α-32P-ATP were incubated without or with wildtype GST-J or the QPD mutant for the indicated times prior analysis by thin-layer chromatography. A representative experiment is shown on the left and the signals from five repeats of the experiment were quantified and the calculated ATP hydrolysis rates are presented on the graph. Error bars represent standard deviations. ****p<0.0001, n.s. p>0.05. (B) Measurement of nucleotide release from BiP in absence of calcium. Unmodified or AMPylated wildtype or V461F mutant BiP proteins were incubated with the fluorescent ADP derivative MABA-ADP and the dissociation of the formed complexes was measured upon dilution with a solution containing excess of ATP to prevent re-binding of MABA-ADP. The dissociation rates of at least three independent repeats are shown. Error bars represent standard deviations. ****p<0.0001, n.s. p>0.05. (C) A similar experiment as in ‘B’ was performed in presence of 2 mM calcium in the solution and without or with Grp170. The dissociation rates of at least five independent repeats are shown. Error bars represent standard deviations. *p=0.0281, ****p<0.0001, n.s. p>0.05.

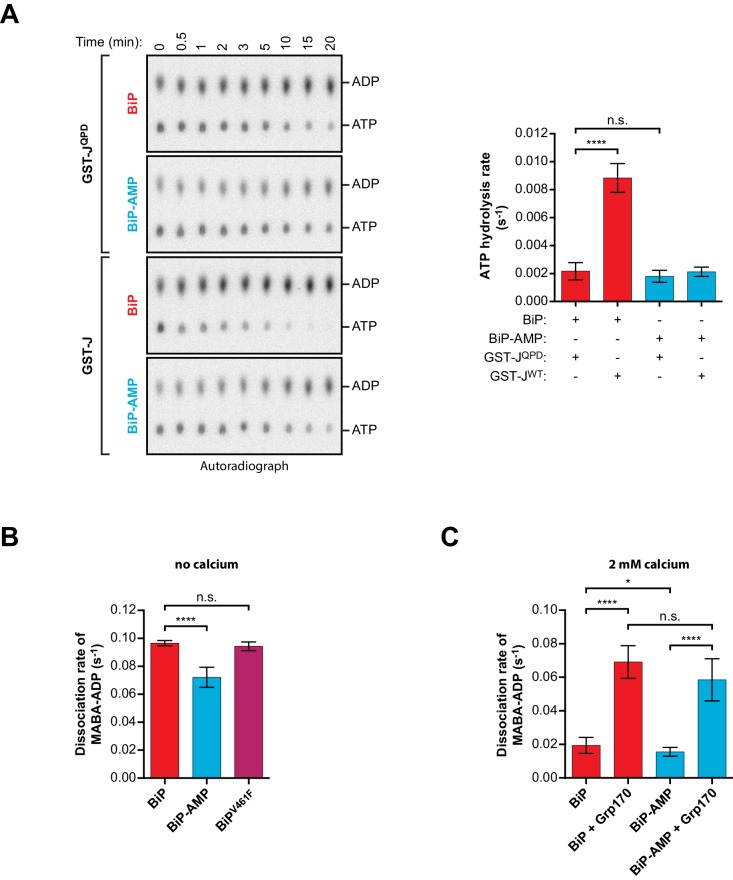
Figure 6—source data 1. Source data and calculated rates for the single-turnover ATPase assays shown in Figure 6A.
DOI: 10.7554/eLife.29428.021
Figure 6—source data 2. Source data and calculated rates for the MABA-ADP release measurements shown in Figure 6B.
DOI: 10.7554/eLife.29428.022
Figure 6—source data 3. Source data and calculated rates for the MABA-ADP release measurements shown in Figure 6C.
elife-29428-fig6-data3.xlsx (503.4KB, xlsx)
DOI: 10.7554/eLife.29428.023

Figure 6.

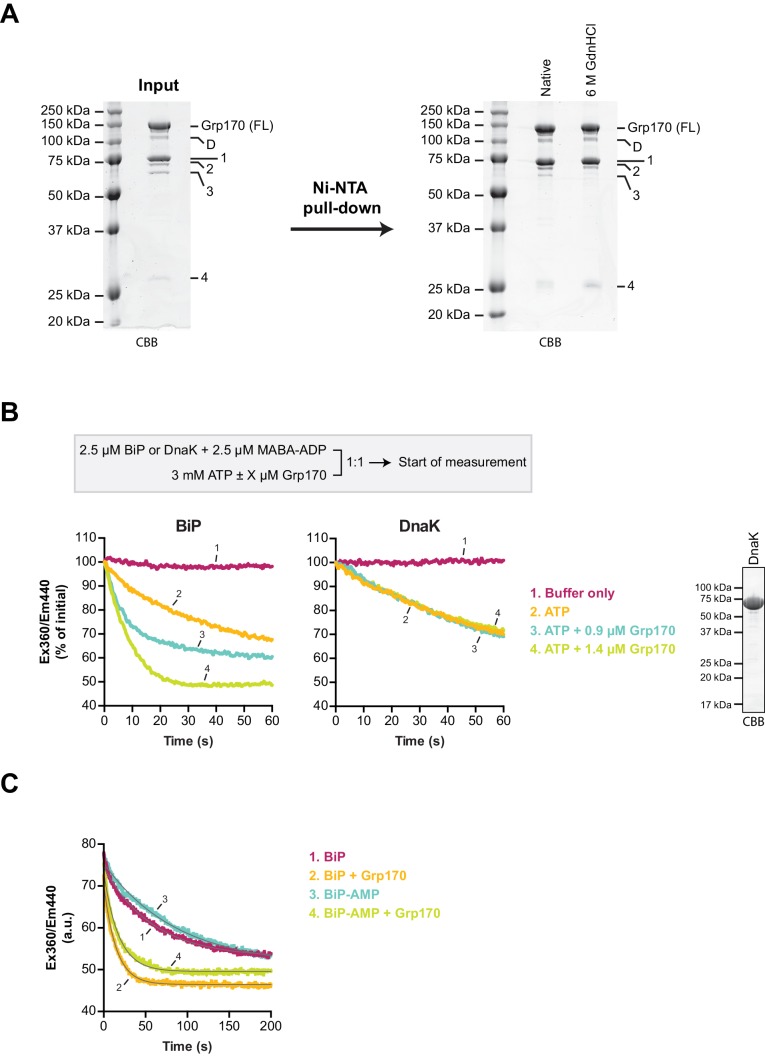
Figure 6—figure supplement 1. Grp170 stimulates MABA-ADP release from BiP.

Figure 6—figure supplement 1.

(A) Coomassie (CBB)-stained SDS-PAGE gels of bacterially expressed and purified human Grp170 protein carrying an N-terminal His6-tag. A sample of the protein preparation was applied to SDS-PAGE (left) and the full-length protein (FL) as well as co-purified faster migrating species (D and 1–4) are indicated. The latter contain mainly Grp170-derived peptides as identified by mass spectrometry analysis (Supplementary file 1). A Ni-NTA affinity pull-down (right) under native conditions or upon denaturation with 6 M guanidine hydrochloride (GdnHCl) supports their identity as N-terminal proteolytic fragments of Grp170 (carrying a His6-tag) and indicates only minor contamination of the preparation with other proteins. (B) Measurement of nucleotide release from BiP or DnaK in presence of 2 mM calcium. Unmodified wildtype BiP (or DnaK) protein (2.5 µM) was incubated with the fluorescent ADP derivative MABA-ADP (at 2.5 µM) and the dissociation of the formed complexes was measured over time upon 1:1 dilution with a solution containing 3 mM ATP without or with Grp170 (at 0.9 µM or 1.4 µM) as depicted on the scheme. MABA-ADP fluorescence was detected by excitation at 360 nm and recording the emission signal at 440 nm. The Coomassie-stained SDS-PAGE gel on the right shows purified DnaK used in this assay. (C) Representative measurement of MABA-ADP release from unmodified or AMPylated BiP (BiP-AMP) as in ‘B’ upon dilution into an ATP-containing solution without or with 1.4 µM Grp170. The raw fluorescence traces were fitted to a single exponential function (grey curves) to calculate the dissociation rate constants presented in Figure 6C.