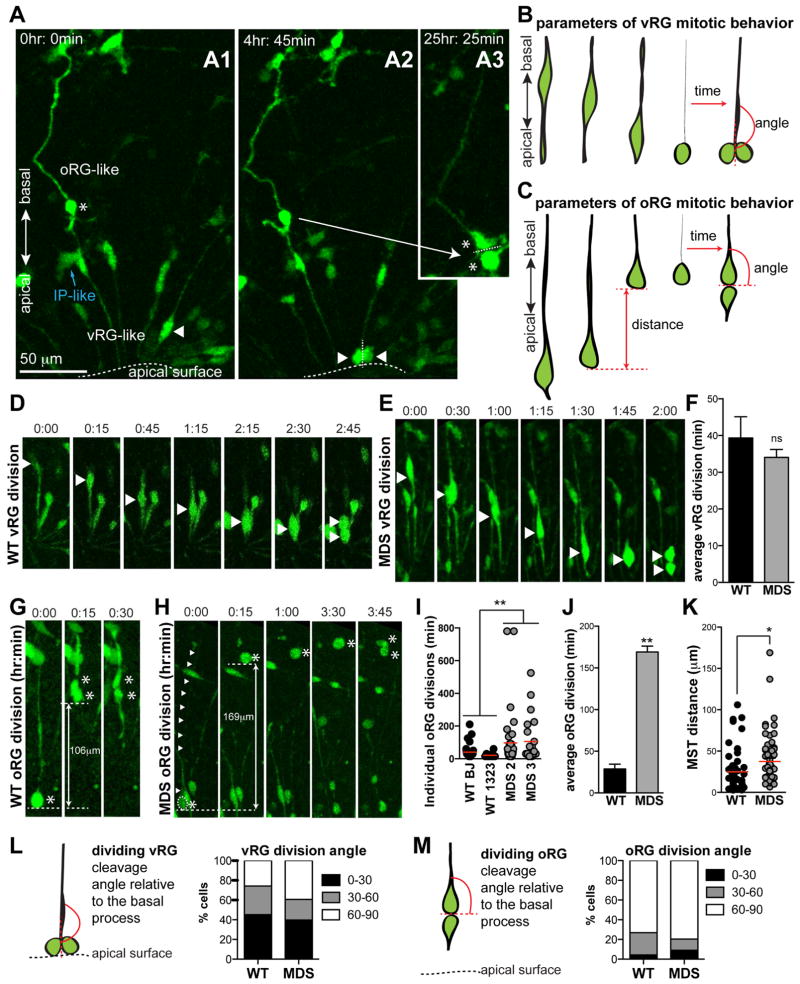
Figure 6. Prolonged mitosis in MDS oRG but not vRG cells at 10 weeks (see also Figure S5, Movie S5 and Table S2).
(A) Frames from time-lapse imaging showing representative examples of distinct vRG and oRG cell morphology, orientation and dividing properties in the same imaging field. The oRG-like cell is marked with a white star. Note the long basal process, and its superficial location relative to the bipolar vRG-like cells (example: white arrowhead). The indicated bipolar vRG-like cell from panel A1 moves apically and divides in A2 with a cleavage angle parallel to its basal process. In contrast, the indicated oRG-like cell undergoes an MST in the basal direction (not shown) and divides in A3 with a cleavage angle perpendicular to its basal process. Scale bar=50μm. (B) Schematic of parameters used to analyze vRG mitotic behavior: time from cell rounding to the first appearance of two daughters, angle of cleavage relative to the cell body axis just prior to basal process retraction. (C) Schematic of parameters used to analyze oRG mitotic behavior: MST distance, time from cell rounding to the first appearance of two daughters, angle of cleavage relative to the basal process. (D,E) Frames from time-lapse imaging showing representative examples of WT (D) and MDS (E) vRG-like divisions. (F) divisions. (I,J) Quantification of oRG division time (p=0.0028). (K) Quantification of oRG MST distance (p=0.05). (L, M) Quantification of vRG (L) and oRG (M) cleavage angle relative to the basal process. Average values ± S.E.M. are plotted in F and J. Statistical analysis was done using t-test (WT n=3; MDS n=2). For all the phenotypes, 20–50 cells were analyzed from each individual.

