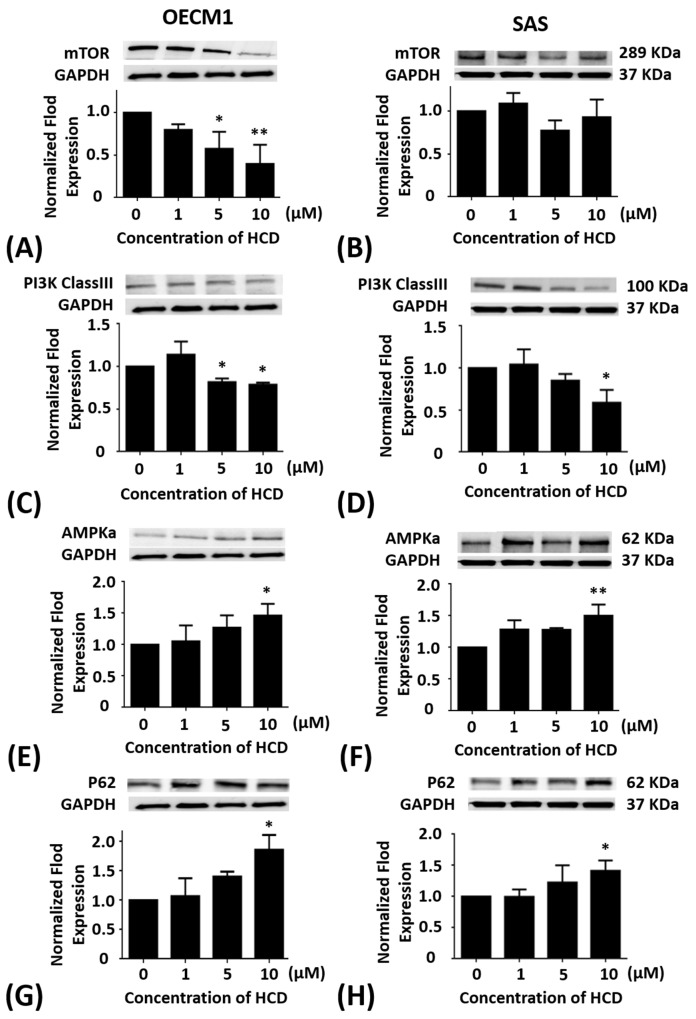
Figure 2. Altered protein levels of mTOR, PI3K Class III, AMPKα, and P62 of OECM1 and SAS cells treated with HCD.
OECM1 and SAS cells were treated with 1, 5, and 10 μM of HCD for 24 h. Cells were lysed in RIPA buffer for the Western blot. Quantization of the expressions of (A and B) mTOR, (C and D) PI3K Class III, (E and F) AMPKα, and (G and H) P62 protein levels were performed, respectively. The results were presented as the mean ± SE of three independent experiments. *P < 0.05 and ** P < 0.01 when compared with the untreated control (0 μM).

