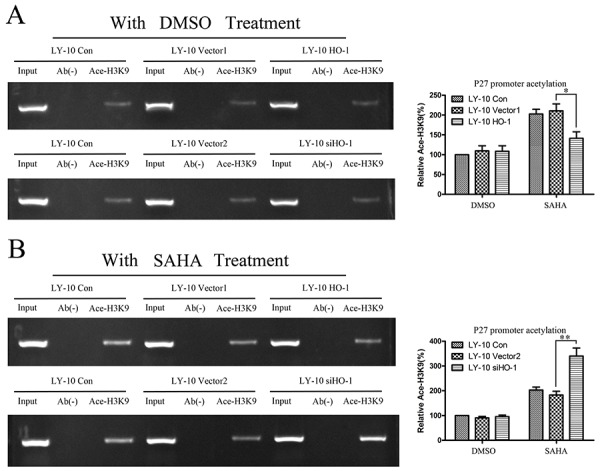
Figure 6. Histone acetylation level of P27Kip1 promoter in LY-10 cells.

(A, B) LY-10 cells were grouped into LY-10 (control), LY-10 (vector 1), LY-10 (HO-1), LY-10 (vector 2), and LY-10 (siHO-1). Different groups of LY-10 cells were treated with SAHA (8 μM) or DMSO (0.1%). CHIP-PCR was employed to identify changes in the histone acetylation H3K9 levels at P27Kip1 promoter in different groups of LY-10 cells. P27Kip1 promoter sequences in the input DNA that was recovered from antibody-bound chromatin segments were quantified by PCR and normalized to corresponding input controls. P27Kip1 promoter histone acetylation was examined by agarose gel electrophoresis and quantified with Quantity One software. Data are representative of at least three independent experiments. *P<0.05, **P<0.01.
