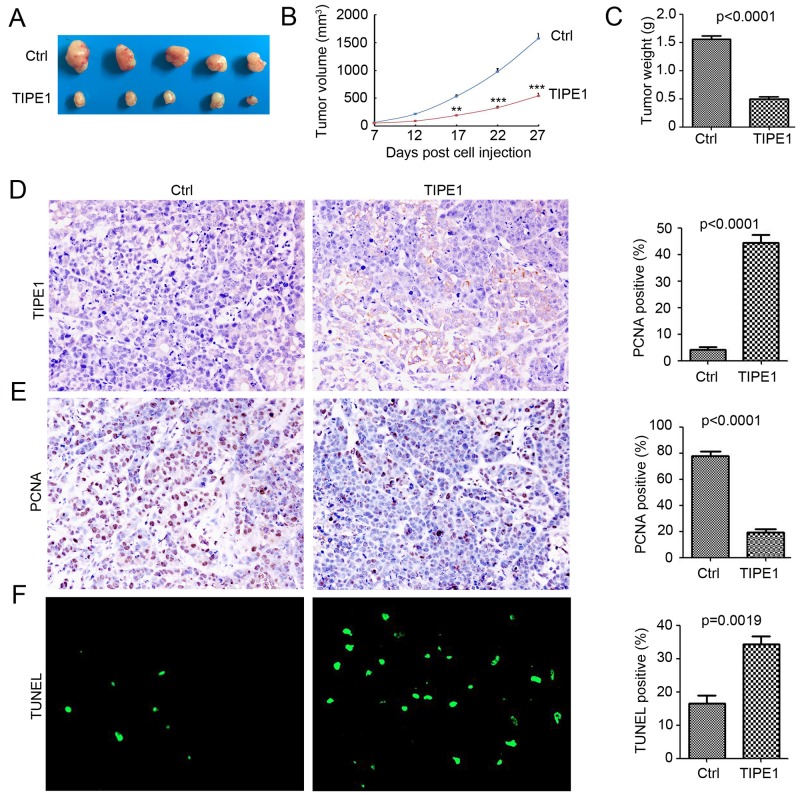
Figure 5. TIPE1 inhibited tumorigenesis in vivo.
(A) Ten BALB/c nude mice were randomly divided into two groups (5 mice per group) and subjected to injection with A549-Ctrl and A549-TIPE1 cancer cells. Representative tumors were imaged after sacrifice to visually assess tumor growth. (B) The average tumor volume in each group (n=5) is shown as a function of time (**, p<0.01; ***, p<0.001, compared with Ctrl group). (C) tumor weight in each group (n=5) is shown (**, p<0.01, compared with Ctrl group). (D and E) IHC for analysis of TIPE1 and PCNA protein expression in Ctrl and TIPE1 A549 tumor tissues. Percentage of positive cells were analyzed (n=5). (F) TUNEL for analysis of apoptosis cells in Ctrl and TIPE1 A549 tumor tissues. Percentage of apoptosis cells were analyzed (n=5).

