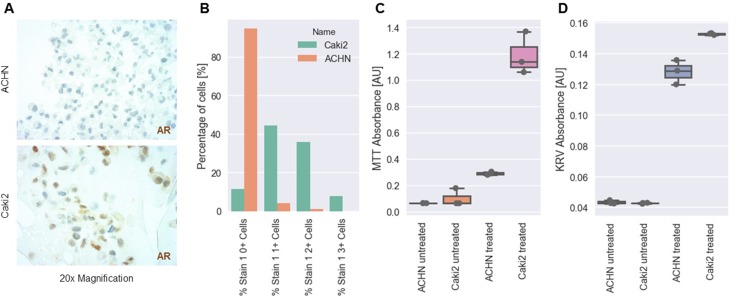
Figure 5. In vitro analysis of AR expression and treatment in RCC cell lines.
(A) Representative images of AR expression in two different RCC cell lines (ACHN: upper panel, Caki2: lower panel) as determined by IHC. (B) Percentage of negative (0+), weakly positive (1+), moderately positive (2+) and strongly positive (3+) cells. (C) MTT absorbance (cell viability) of ACHN and Caki2 cells after treatment with Cl-4AS-1, a steroidal androgen receptor agonist. (D) Cresylviolett (KRV) assay absorbance of ACHN and Caki2 cells after treatment with Cl-4AS-1, a steroidal androgen receptor agonist. [AU] = arbitrary unit.

