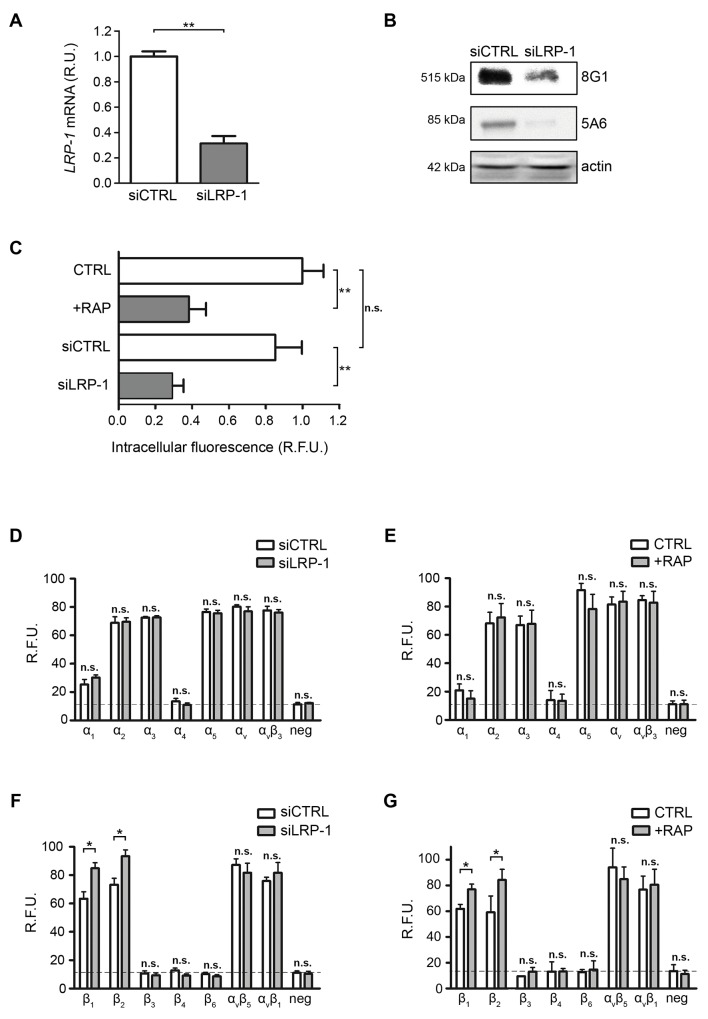
Figure 1. Cell surface β1-integrin accumulates under LRP-1 inhibition or silencing.
(A) Total RNAs were purified from FTC-133 cells transfected with non-silencing siRNA (siCTRL) or siRNA targeting LRP1 (siLRP-1). LRP1 mRNA expression was quantified using real-time RT-PCR and expressed as relative units (R.U.). RPL32 and RS18 were used for normalization. siCTRL cells served as a reference set to 1. (B) LRP-1 protein expression from FTC-133 cells transfected with non-silencing siRNA (siCTRL) or siRNA targeting LRP1 (siLRP-1) was assessed by SDS-PAGE immunoblotting of LRP-1 α chain (8G1) and LRP-1 β chain (5A6). (C) Wild-type FTC-133 cells (WT) were treated in presence or absence of 500 nM RAP or transfected with siRNA sequences (siCTRL and siLRP-1), and then incubated for 30 min in serum-free medium containing FITC-labeled human α2-macroglobulin. The intracellular fluorescence reflecting endocytosis activity was determined as described elsewhere [20] and is expressed as relative fluorescence units (R.F.U.), by comparison with signal from untreated WT cells (CTRL). (D-G) α- and β-integrin subunits were quantified at FTC-133 cell surface using an antibody array under LRP1 silencing (siLRP-1) (D and F) or 500 nM RAP treatment (E and G). The specific signal threshold was established using negative controls (neg) and is represented by dotted lines. Each value is the mean ± SD for at least three independent experiments, each performed in triplicate. n.s., not significant; *, P < 0.05; **, P < 0.01; as compared to the corresponding CTRL or siCTRL condition (white bars).

