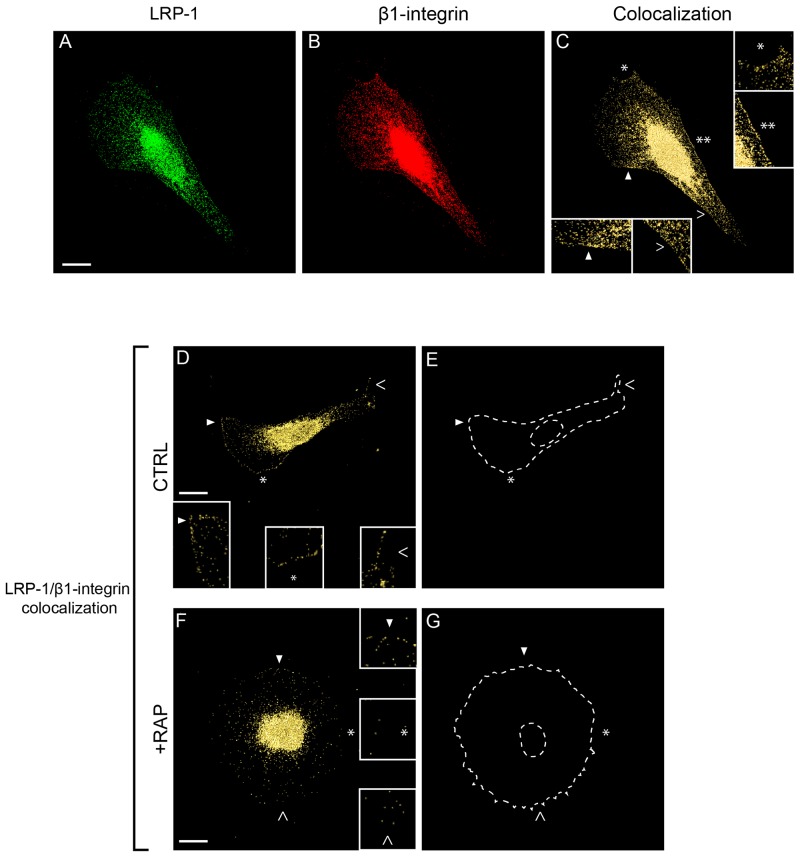
Figure 4. Endogenous β1-integrin colocalizes with LRP-1 in FTC-133 cells.
FTC-133 cells were seeded onto 1% gelatin-coated coverslips and allowed to grow 24 h in control conditions (A to E, CTRL) or under 500 nM RAP treatment during 1h (F-G, +RAP). Cell labeling was conducted using Alexa Fluor 488 for LRP-1 α-chain (A) and Alexa Fluor 568 for β1-integrin (B) both validated for immunofluorescence (data not shown) before confocal microscopy analysis. Colocalization between LRP-1 and β1-integrin is represented in yellow in C, D and F panels. Two-fold enlargements (insets) are indicated by empty and full arrowheads or by white stars, highlighting cell membrane regions (C to G). E and G were used as patterns to represent cell shapes of D and F, respectively. Images were treated with AMIRA software and correspond to isosurface representations, as indicated in Materials and Methods. Bars: 10 μm.

