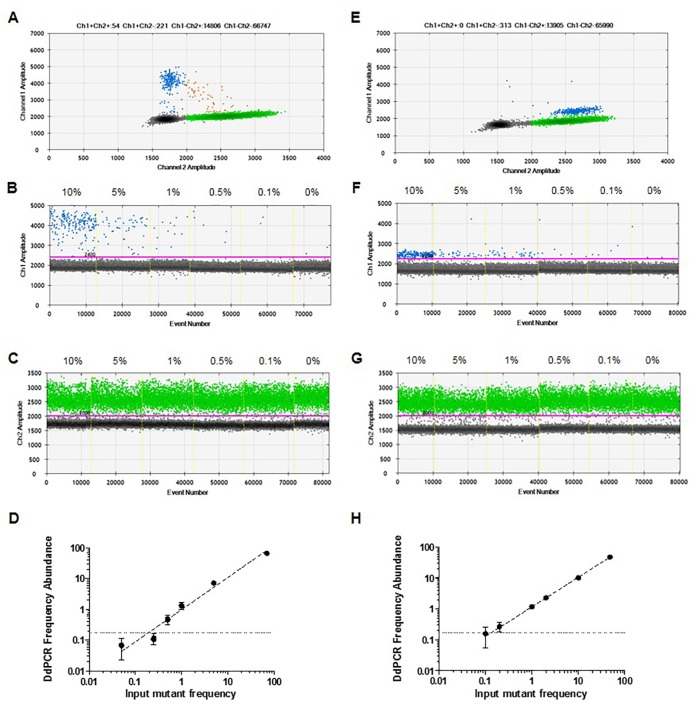
Figure 3. Detection of TERT promoter mutations in the presence of homologous wild-type DNA.
Serial dilutions of DNA from mutant cell lines 1205Lu – C228T (A-D) and UACC62 – C250T (E-H) were prepared in a constant background of wild-type human genomic DNA. 2D plots of ddPCR read out at 10% of mutant DNA (A and E). 1D plots indicating mutant (B and F) and wild-type (C and G) DNA detection. Analytical sensitivity (LOD) of the assay (D and H). Obtained frequency abundances and standard deviations were plotted versus expected mutant frequencies based on input. The LOD, defined as 2 SD over the mean frequency abundance obtained at 0% when only wild-type DNA was used as input, was indicated as dashed lines in both graphs.

