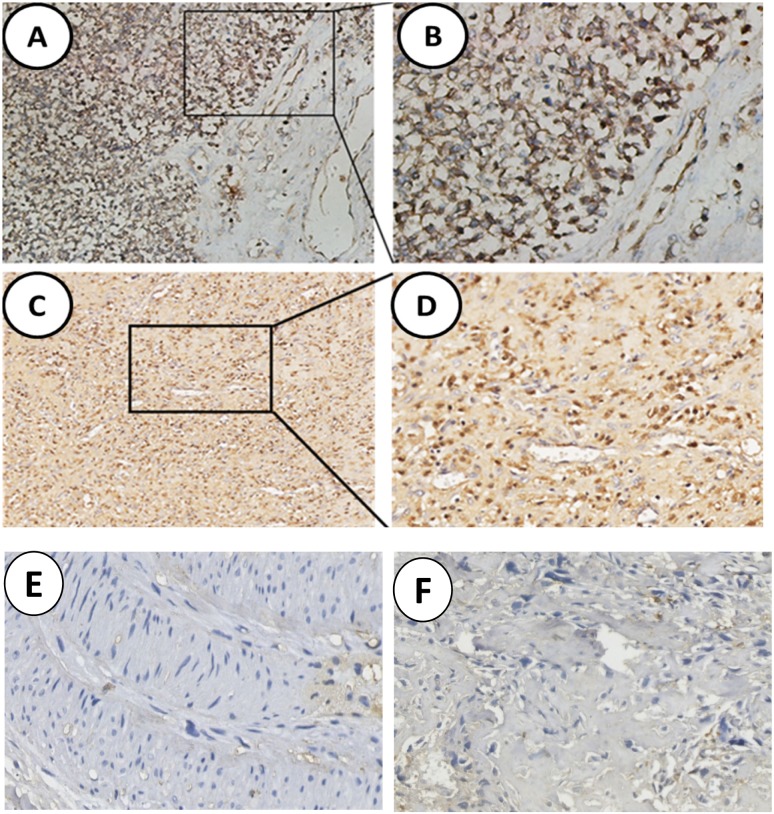
Figure 1. Analysis of SNAT1 expression in human osteosarcoma.
(A, C) High level of SNAT1 expression in tumor cells; (B, D) Enlargement of tissues in the frames from A, C, respectively. (E, F) Noncancerous tissues showed negative staining of SNAT1. Original magnification of A, C: 100×; Original magnification of B, D-F: 200×.

