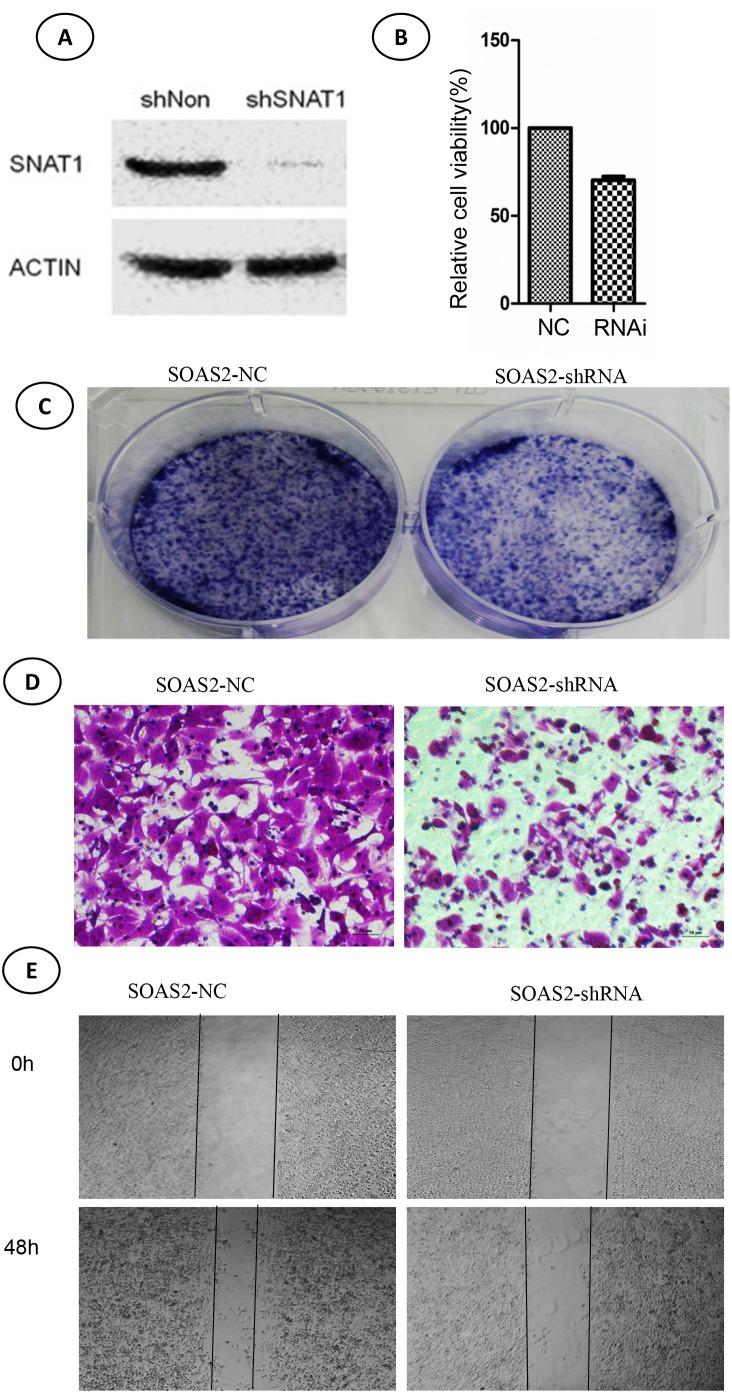
Figure 3. Effects of SNAT-shRNA on cell viability, colony formation, and migration in soas-2 cell lines.
(A) Western blotting showed expression of SNAT1 after transfection with SNAT1-shRNA and control for 48 hours. (B) Cell viability was determined by CCK8 assay. (C) Cell viability was determined by colony formation assay. (D, E) Cell migration was determined by transwell assay (D) and wound healing assay (E).

