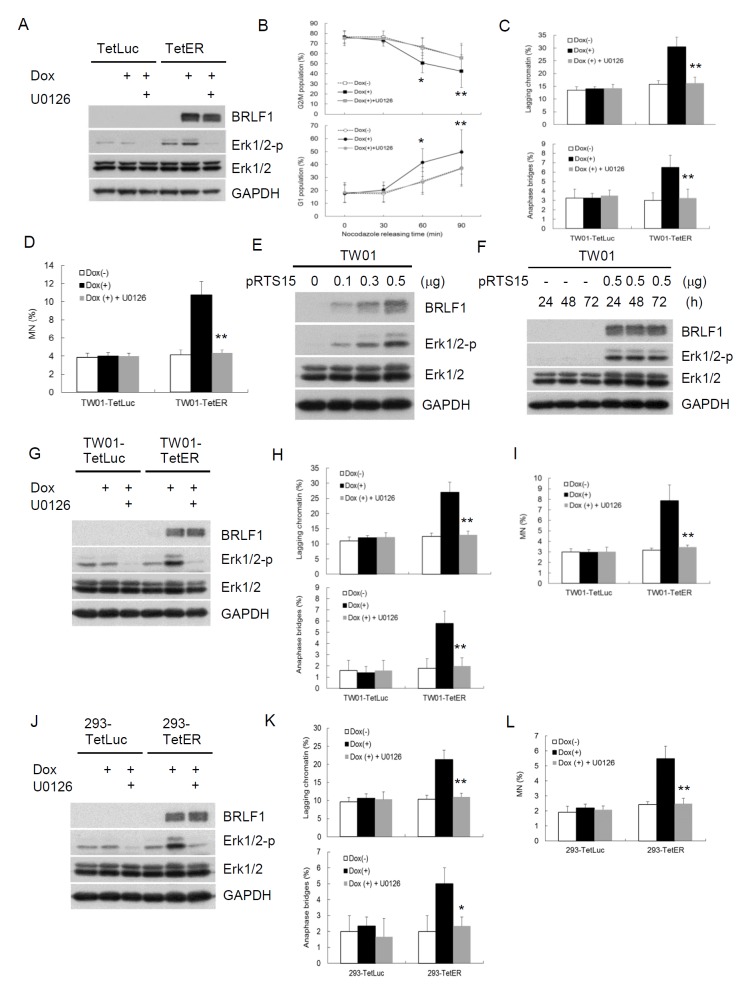
Figure 6. BRLF1 induces GI by chromosome mis-segregation through activation of Erk signaling.
(A) Nocodazole-arrested cells co-treated with 50 ng/ml Dox and 20 μM U0126 for 24 h were collected by shake-off. Western blot analysis was performed to detect the indicated proteins. (B) TW01-TetER cells from (A) were then released into fresh medium. The samples were collected at the indicated time and cell cycle profiles were analyzed by flow cytometry. Data are presented as means ± SD. *, P < 0.05; **, P < 0.01, compared to U0126 treatment at the same time point. (C) The samplesat 60 min after nocodazole release were analyzed to determine chromosome-segregation defects and subjected to (D) micronucleus formation assay. Data are presented as means ± SD. **, P < 0.01, compared to Dox(+) treatment at the same cell. (E) TW01 cells were transiently transfected with the doses of pRTS15 for 24 h or (F) with 0.5 μg pRTS15 for 24, 48 and 72h. Western blotting was performed to detect the indicated protein levels. (G) The cells were co-treated with 50 ng/ml Dox and 20 μM U0126 for 24 h and subjected towestern blotting todetect the indicated protein levels. (H) The samples from (G) were analyzed to determine chromosome-segregation defects and subjected to (I) micronucleus formation assay. Data are presented as means ± SD. **, P < 0.01, compared to Dox(+) treatment at the same cell. (J) The cells were co-treated with 50 ng/ml Dox and 20 μM U0126 for 24 h and subjected towestern blotting todetect the indicated protein levels. (K) The samples from (J) were analyzed to determine chromosome-segregation defects and subjected to (L) micronucleus formation assay. Data are presented as means ± SD. *, P < 0.05; **, P < 0.01, compared to Dox(+) treatment at the same cell.

