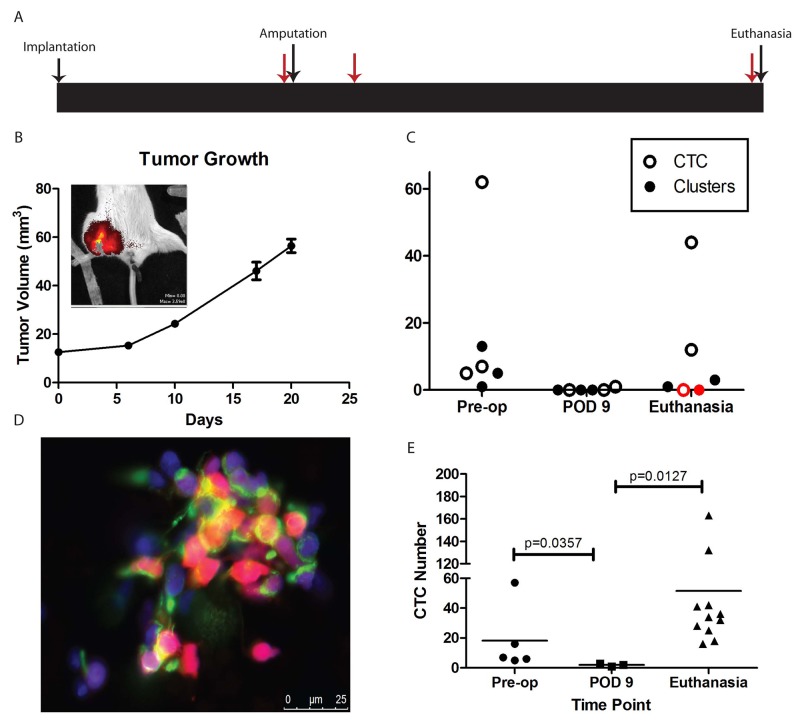
Figure 2. CTC in animal models.
(A) Schematic of experimental design. Major events (tumor implantation, hindlimb amputation, and euthanasia) are indicated with black arrows. Time points of blood draws are indicated with red arrows. (B) Growth curve of TC71 xenograft implanted in the pretibial space of NSG mice. Legs were amputated on Day 28, and mice were euthanized on either Day 35 or Day 56. Inset shows IVIS imaging to confirm retention of tdTomato in the growing tumor. (C) Numbers of CTC and CTC clusters recovered from each mouse. Note that the mouse with red symbols was found to have no evidence of disease on necropsy. (D) Representative image of a cluster of CTC recovered from one of the mice. Endogenous tdTomato is red, nuclei stained with DAPI are blue, and vimentin is green. (E) Quantification of CTC isolated from NSG mice bearing a TC32 xenograft. Mice were euthanized either at the time of amputation (“Pre-op”), on Day 9 after amputation (“POD 9”), or on Day 30 after amputation (“Euthanasia”), when subclinical metastases were expected to be present. Horizontal line represents the median value. Statistical analysis was performed using the Mann-Whitney test given deviation of the data from a normal distribution.

