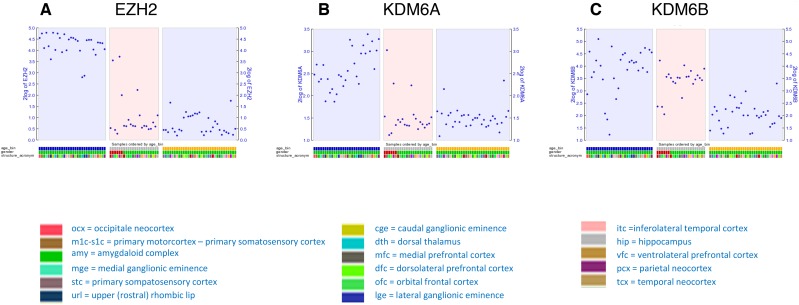
Figure 2.
Dot plot showing transcript levels of EZH2 (A), KDM6A (B) and KDM6B (C) during human development as reported in the Brainspan database. Depicted are stage 2A (corresponding with 9 weeks GSA; early prenatal – blue), stage 5 (corresponding to 28 and 33 weeks GSA; late prenatal – gray), and stage 6 (corresponding to 40 weeks GSA; birth-early infancy – yellow).

