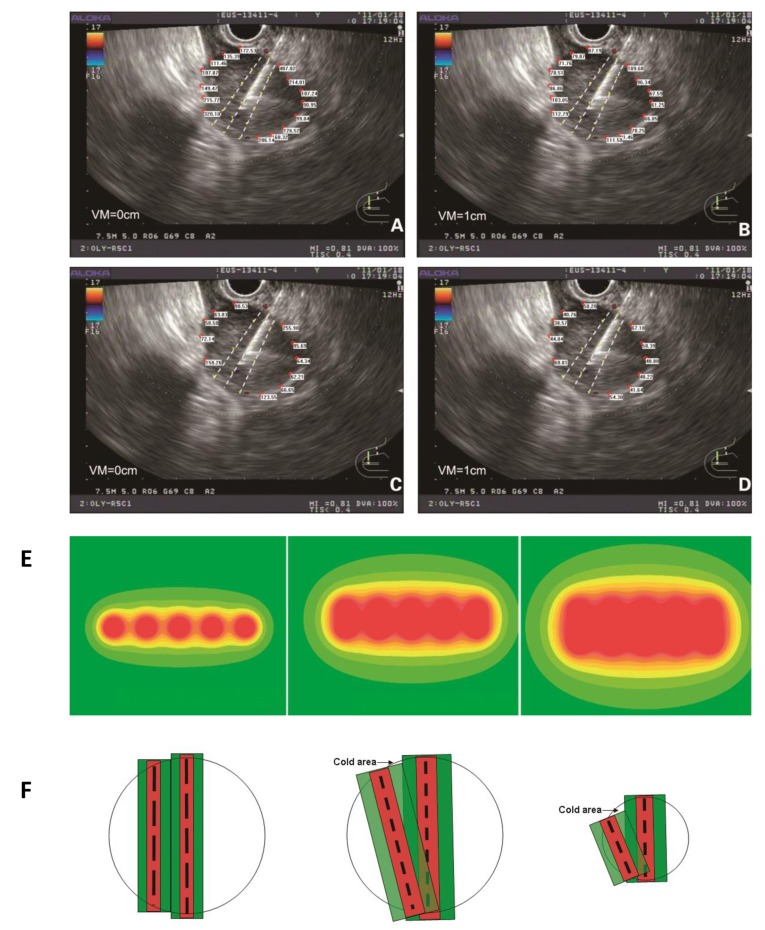
Figure 1.
The peripheral dose distribution at the edge of the tumor was calculated at 5-mm interval (A), and the change in the dose distribution after 10-mm vertical movement were also detected (B). The peripheral dose distribution at the edge of the tumor was calculated at 10-mm interval (C.) with the change in the dose distribution after 10-mm vertical movement (D.) E. The peripheral dose distribution of a radioactive seed chain (5 seeds, 5-mm interval) (left), of two parallel radioactive seed chains (5 seeds, 5-mm interval) (middle) and of three parallel radioactive seed chains (5 seeds, 5-mm interval) (right) indicated that in accordance with the descending order of doses, the color changes gradually from red to yellow. Local irradiation doses <90 Gy were shown as a green coloration. F. The dose distribution between two parallel puncture planes under traditional prostate brachytherapy (left). The cold area of dose distribution between two puncture planes under EUS-guided brachytherapy (middle). The long black dotted line represents the radioactive seed chain at 10-mm interval. The short black dotted line represents the radioactive seed chain at 5-mm interval. The absorbed dose was greater than the therapeutic dose in red area. And in green area, the absorbed dose was between the therapeutic dose and 1/2 therapeutic dose. When the tumor was larger in diameter, the cold area (black arrow) was not obvious under the small rotation angle. When the tumor diameter was small, the cold area (black arrow) was obvious (right). VM: vertical movement.

