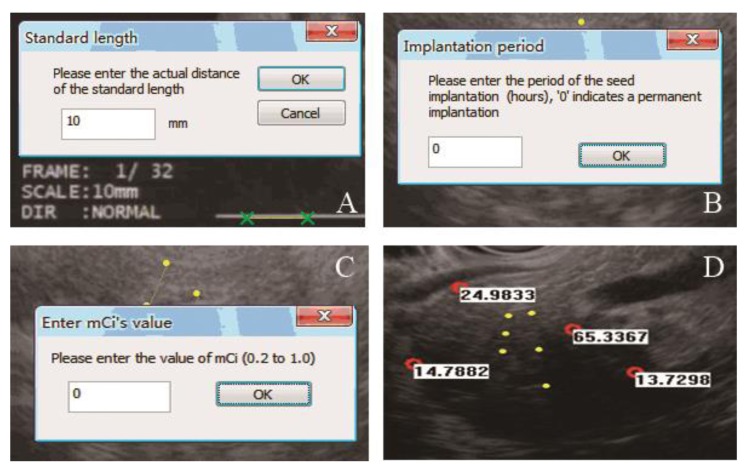
Figure 5. EUS TPS procedures were shown.
A. The standard length was entered according to the actual length on the image. B. The period of seed implantation (hours) was entered in this window. C. The single activity of a radioactive seed was entered. D. The planted seeds are shown in the image as yellow dots. The absorbed radiation dose (Gy) is shown beside each selected point (red dots).

