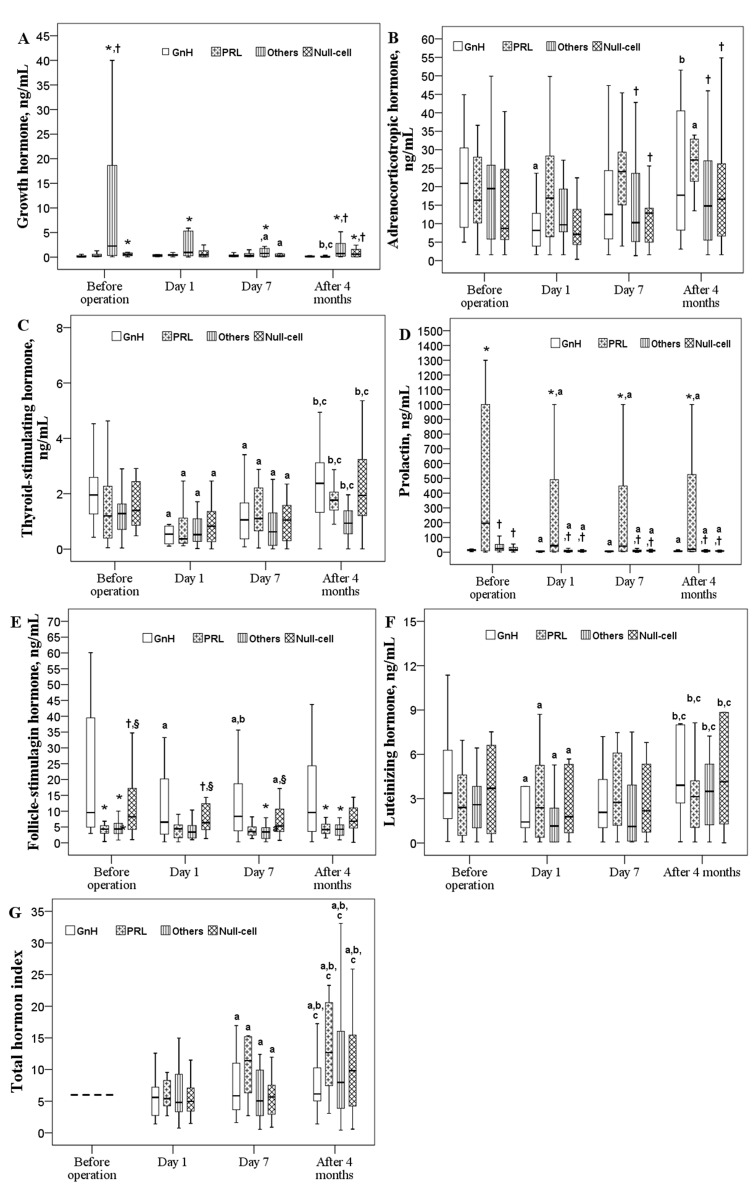
Figure 1. Changes in six pituitary hormones over time in patients with different histological types (n = 81).
Box plot consists of median (middle line), the P25 (bottom of the box) and the P75 (top of the box) percentiles. Log transformation was preceded prior to doing analysis. Data were tested by generalized estimation equation (GEE). a-c significantly different from baseline a, postoperative day 1 b, or postoperative day 7 c, P < 0.05. * significantly different from the GnH type, P < 0.05. † significantly different from the PRL type, P < 0.05. § significantly different from other types, P < 0.05.

