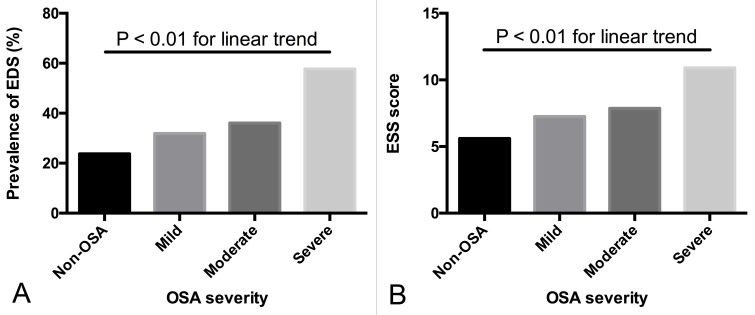
Figure 2. Prevalence of EDS and ESS score in different OSA categories.
A. The prevalence of EDS increased as the severity of OSA increased (p for trend <0.01). B. The ESS score increased as the severity of OSA increased (p for trend < 0.01). The linear-by-linear association test was used for dichotomous variables and the polynomial linear trend test was used for continuous variables.

