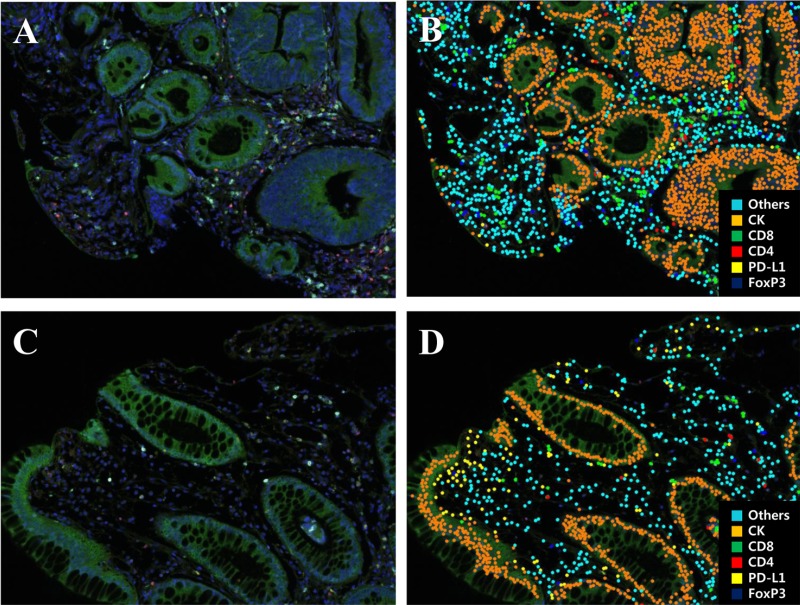
Figure 1. Representative multiplex IF images of pretreatment rectal cancer biopsy tissue.
(A, C) A spectral composite image created according to the spectral library for each fluorescent probe (Opal 690, Opal 650, Opal 620, Opal 570, Opal 520, and DAPI). (B, D) Cell phenotype map of rectal cancer biopsy tissue as a previously designated color (Blue, FoxP3; Yellow, PD-L1; Red, CD4; Green, CD8; Orange, cytokeratin; Sky blue, others).

