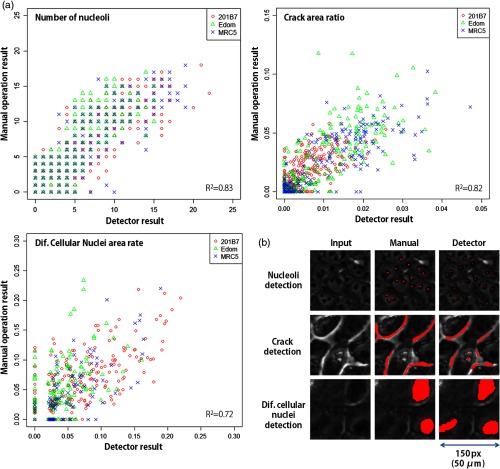
Fig. 6.
Performance of the developed feature detectors. (a) Correlation between the detectors and the visual inspection results with respect to the cell lines and (b) examples of the detection results. In (b), the red area indicates the area detected by the expert and the detectors. The differences in the manual and detector images are due to errors by the detectors.

