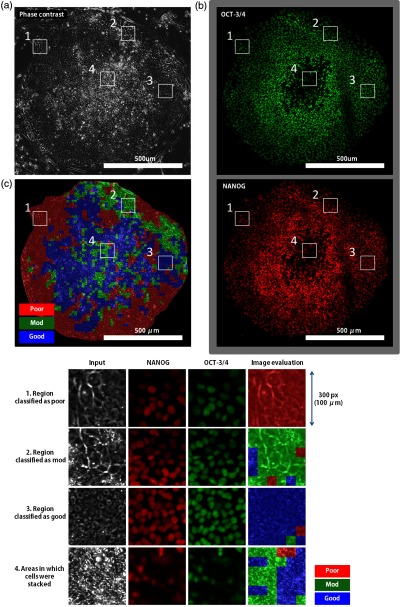
Fig. 7.
Comparison between the image evaluation result and the immunostaining result. (a) Input phase contrast image, (b) images following immunostaining with OCT-3/4 and NANOG, which are markers of nondifferentiation, and (c) the image evaluation result, and a closed-up comparison of each result. The image evaluation result and the immunostaining result correspond to poor and good regions, respectively, except for the area in which cells were stacked (center of the images).

