
Figure 3. CD11c+ dendritic cells are not essential for HEV neogenesis in tumors.
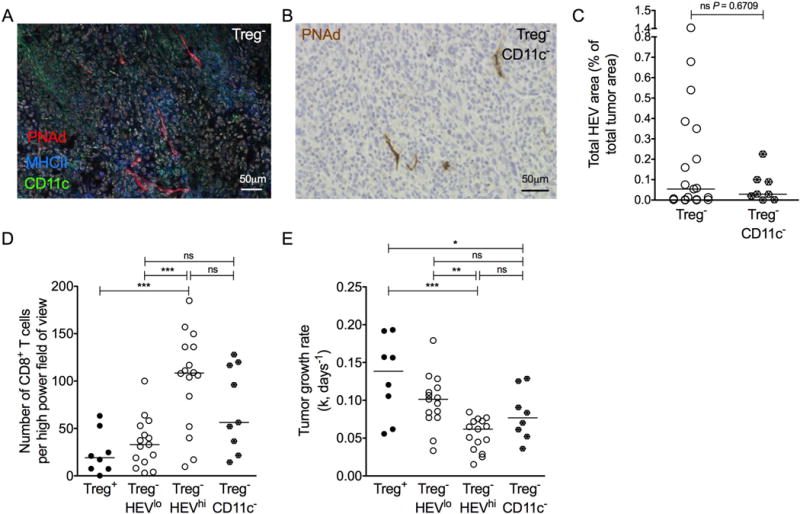
(A) Representative image of HEVs (PNAd+; red) alongside MHC Class II+ (blue) and CD11c+ (green) DCs in a tumor of a Treg− Foxp3DTR animal. (B) Representative image of HEVs (PNAd+; brown) in tumor of a Treg− CD11c− CD11c.DOG-Foxp3DTR animal. Counterstain: haematoxylin. (C) Total HEV area of Treg− CD11c− mice compared to Treg− controls. Data are presented as individual data points (individual mice) plus median. Statistical significance was determined by Mann Whitney t tests. n = 8 Treg− CD11c− animals; n = 19 Treg− animals. (D) Number of CD8+ T cells in tumors of Treg− HEVlo (n = 15) Foxp3DTR animals, Treg− HEVhi (n = 16) Foxp3DTR animals, and Treg− CD11c− CD11c.DOG-Foxp3DTR animals (n = 9). (E) Tumor growth rates (k, days−1) for Treg− HEVlo (n = 15) Foxp3DTR animals, Treg− HEVhi (n = 15) Foxp3DTR animals, and Treg− CD11c− CD11c.DOG-Foxp3DTR animals (n = 8). Statistical significance was determined by one-way ANOVA with Tukey’s test to compare pairs of means (* = P≤0.05, ** = P≤0.01, *** = P≤0.001).