
Figure 5. Response of ribosomal translation factors after CX-5461 treatment.
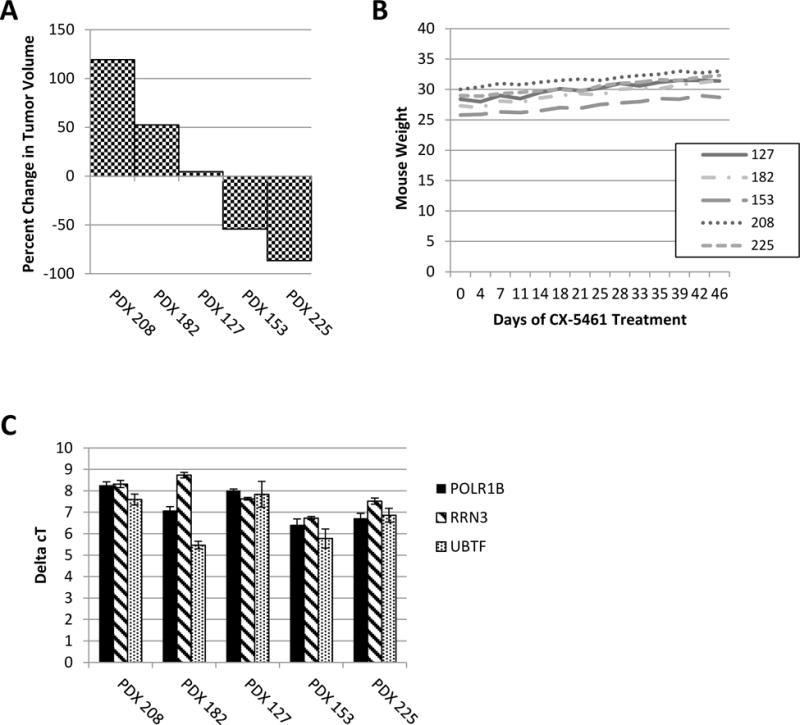
(A) Waterfall plot displaying percent change of tumor volume in PDXs 208, 182, 127, 153, and 225 after 45 days of treatment with 50mg/kg CX-5461 q3D. (B) Weight of mice through duration of treatment with CX-5461. (C) qPCR of Pol I initiation factors RRN3, POLR1B, and UBTF. ΔCT was calculated. There was not an association between baseline expression of these genes and response to CX-5461.