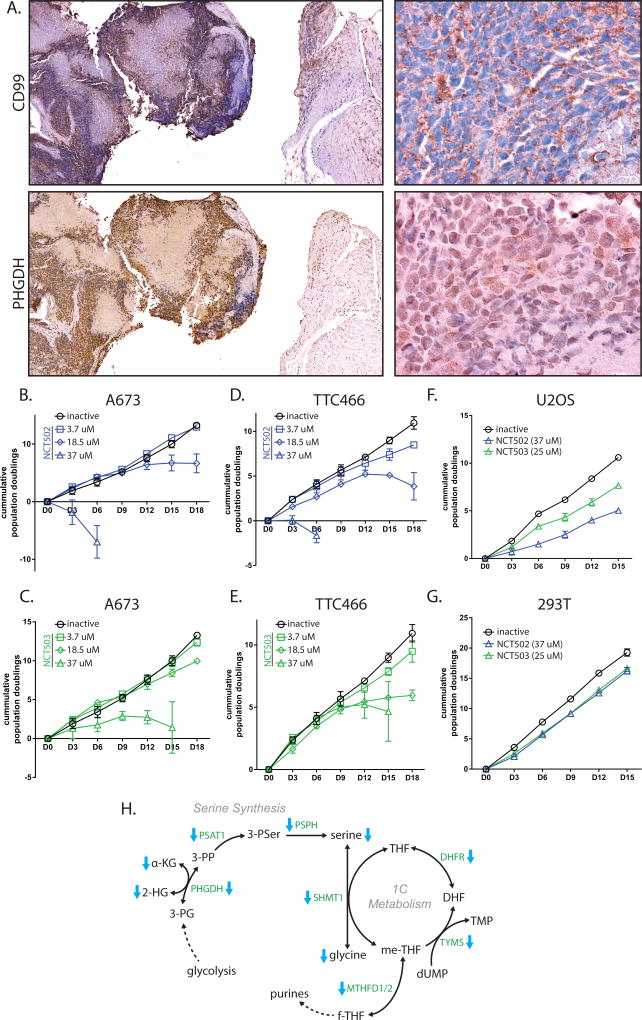
Figure 5. PHGDH is high in Ewing sarcoma tumors, and is important for cell viability.
A. Immunohistochemistry of CD99 and PHGDH in Ewing sarcoma tumors from a Ewing sarcoma patient. Cell surface staining of CD99 is diagnostic for Ewing sarcoma. Cytosolic staining of PHGDH closely correlates with regions of tumor, indicating elevated PHGDH levels in tumor vs. adjacent tissue. B & C. PHGDH inibition in A673 cells by NCT502 and NCT503 causes decreased cell growth and eventual cell death. D & E. PHGDH inhibition also impaired cell growth of TTC466 cells. F & G. High-dose treatment of osteosarcoma cells (U2OS) and 293T cells show some growth defect, but not as much as in Ewing sarcoma cell lines. H. Diagramatic representation of serine/glycine synthesis and 1-carbon metabolism pathways that are decreased by EF knockdown. Enzymes are green text and metabolites are black text. Blue arrows indicate enzymes or metabolites that were observed as decreased in shEF vs. shLUC cells. Nucleotide and folate analogs were not measured. Co-factors and some intermediates are ommitted for clarity.

