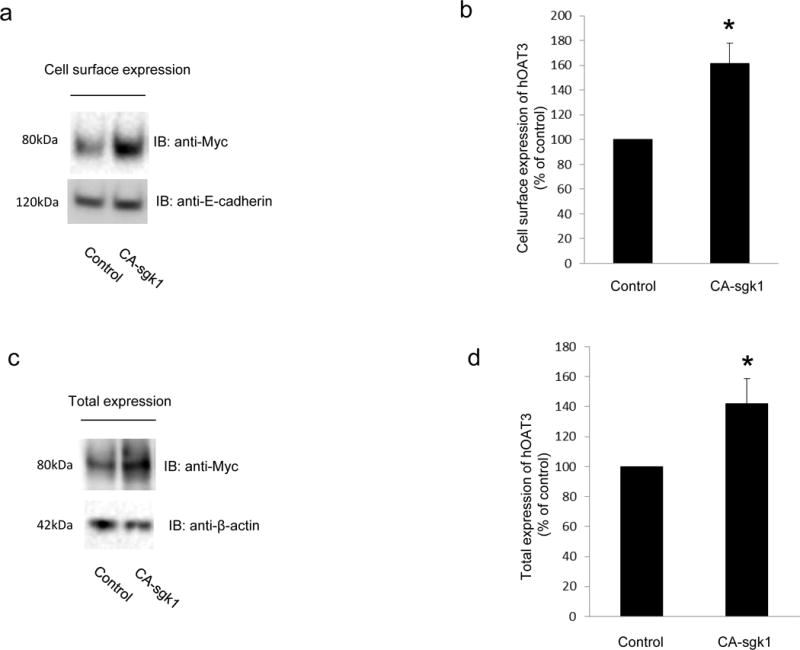
Fig. 4.

Sgk1 enhances hOAT3 expression. a. Top panel: hOAT3 expression at the cell surface. COS-7 cells were co-transfected with hOAT3 and control vector or with hOAT3 and the constitutive active form of sgk1 (CA-sgk1). Cell surface proteins were labeled with biotin, separated with streptavidin beads, followed by immunoblotting (IB) with an anti-myc antibody (epitope myc was tagged to hOAT3 for immune-detection). Bottom panel: The expression of cell surface protein marker E-cadherin. The same blot from the Top panel was re-probed with anti- E-cadherin antibody. b. Densitometry plot of results from Fig. 4a, Top panel as well as from other experiments. c. Top Panel: Total cell expression of hOAT3. COS-7 cells were co-transfected with hOAT3 and control vector or with hOAT3 and CA-sgk1. Transfected cells were lysed, followed by immunoblotting (IB) with an anti-myc antibody. Bottom panel: Total cell expression of cellular protein marker β-actin. The same blot from Top panel was re-probed with anti-β-actin antibody. (d). Densitometry plot of results from Fig. 4c, Top panel as well as from other experiments. The values are mean ± S.E. (n = 3).
