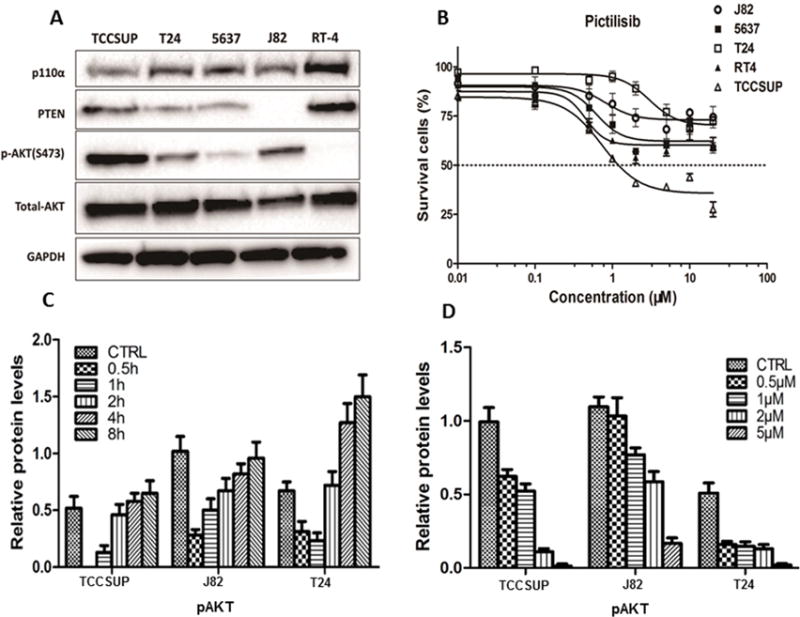
Figure 1. Effect of pictilisib on bladder cancer cell lines.

A, Western blot analysis of proteins along the PI3K/AKT pathway in bladder cancer cell lines. p-AKT was higher in TCCSUP and no PTEN protein expression was observed in J82. p-AKT was not detected in RT4. B, Dose response curve of bladder cancer cell lines treated with pictilisib at different concentrations as determined in a 72-hour MTS cell viability assay. The TCCSUP cell line was the most sensitive to pictilisib treatment with an IC50 value of 1.1 μM, while the other four cell lines were less sensitive with IC50 all greater than 20 μM. C, p-AKT(S473) was inhibited by pictilisib treatment (1 μM) in a time-dependent manner. At 0.5h, p-AKT was completely undetectable in sensitive TCCSUP while it persisted in the resistant J82 and T24 cell lines. D, p-AKT(S473) was inhibited in a dose-dependent way after 1hr of pictilisib treatment.
