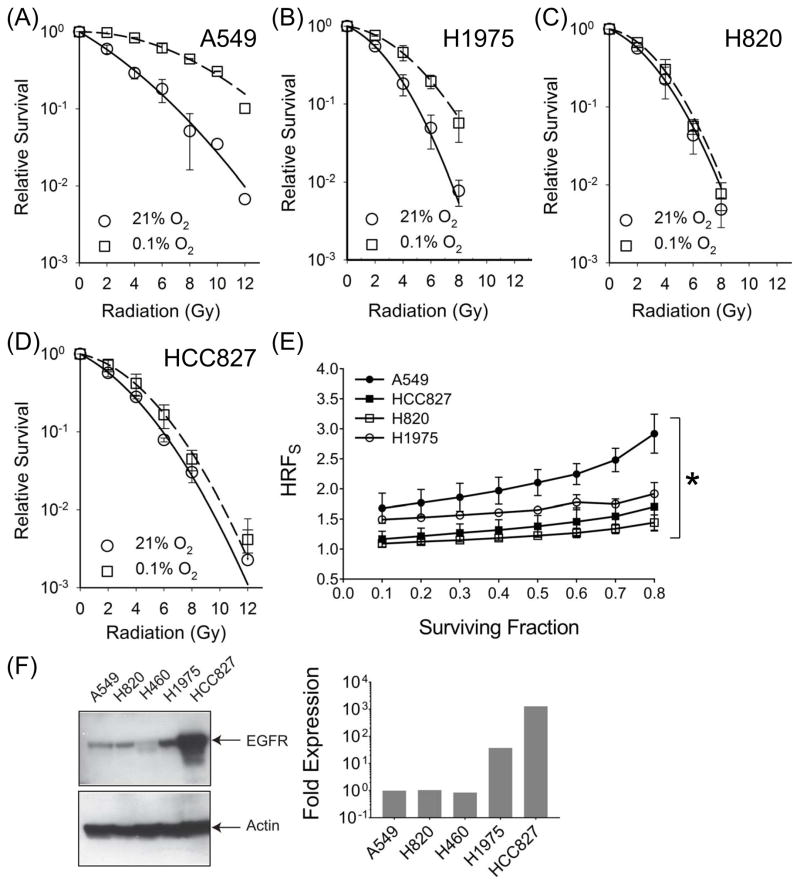
Figure 1.
Hypoxia-associated radiation resistance is compromised in NSCLCs with activating mutations in EGFR. Clonogenic survival assay in NSCLC cell lines, A549 (A), H1975 (B), H820 (C) and HCC827 (D) following a 24 hour exposure to 21% O2 (circles, solid line) or 0.1% O2 (squares, broken lines). Symbols, representing mean SF normalized to PE and error bars representing standard deviation (SD) were derived from at least 3 independent experiments, each with samples in triplicate. (E) Hypoxia reduction factor (signaling) (HRFS) in NSCLCs. HRFS values at SF from 0.1 to 0.8 are shown. Symbols (mean HRFS) and error bars (SD). Asterisk represents summary of an ordinary one way ANOVA test performed between A549 and MT-EGFR NSCLCs where p < 0.001. (F) Western blot analysis (left panel) of whole cell lysates from indicated NSCLCs with WT (A549, H460) and MT-EGFR (H820, H1975, and HCC827). Densitometric analysis (right panel) of EGFR band intensities normalized to β-actin band intensities in each lane. Relative to A549, levels of MT forms of EGFR were at least 1.5 – 3 orders of magnitude higher.

