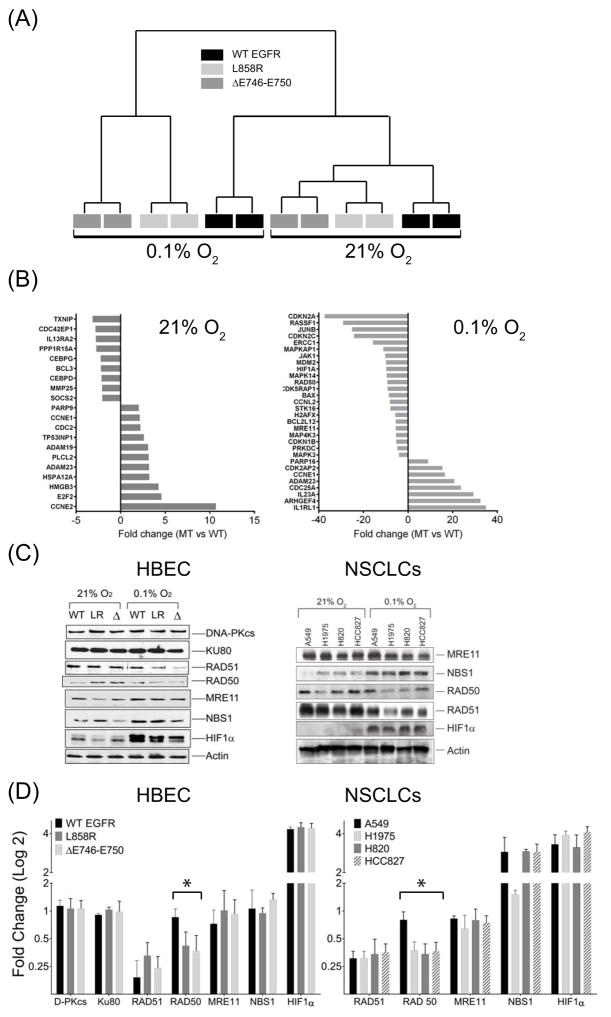
Figure 3.
Microarray gene expression analysis of mRNA isolated from HBEC cells stably expressing wild type (WT, black), L858R (dark gray) or ΔE746–E750 (light gray) forms of EGFR in aerobic (21% O2) conditions or after 24 hours exposure to hypoxic (0.1% O2) environments (A) Unsupervised clustering of genes from different samples. Gene expression patterns of L858R or ΔE746–E750 clustered as one group (MT) which was distinct from WT in both aerobic and hypoxic conditions (B) Fold differences in gene expression in MT-EGFR relative to WT-EGFR cells grown in aerobic (left panel) or hypoxic conditions (right panel). Positive values indicate fold increase; negative values represent fold decrease in expression in MT-EGFR expressing cells, relative to WT-EGFR expressing cells. (C) Western blot analysis of lysates from HBEC cells stably transfected with WT-EGFR (WT), L858R (LR) and ΔE746–E750 (Δ) forms of EGFR (left panel) or indicated NSCLCs (right panel) isolated from cells in aerobic or hypoxic conditions. Representative blots from multiple gels from at least 3 independently performed experiments are shown. (D) Densitometry analysis: Band intensities of individual proteins in 3C were normalized to intensities of the corresponding β-actin band from the same gel as the target protein. Bars represent mean fold change in hypoxic conditions relative to aerobic state and error bars represent SEM (N=3 independent experiments). Asterisk summarizes an ordinary one way ANOVA test performed between WT- and MT-EGFR expressing HBEC or NSCLC cells where p < 0.001.

