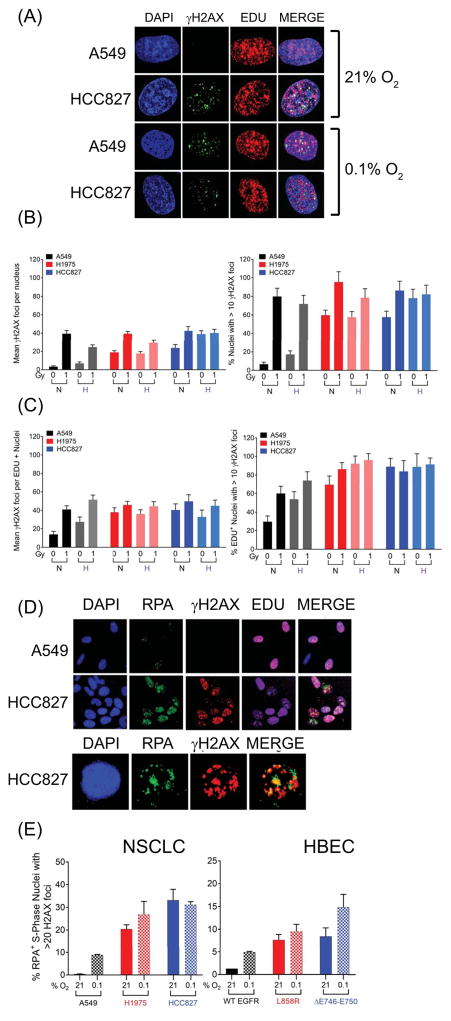
Figure 5.
Elevated MT-EGFR associated γH2AX foci. (A)–(C) NSCLC cells exposed for 24 h to an aerobic (21% O2) or hypoxic (0.1% O2) environment were either mock irradiated (0 Gy) or exposed to radiation (1 Gy), pulsed with EDU and allowed to recover in their respective environments for 45 minutes before being stained for γH2AX and EDU. (A) Representative images of un-irradiated cells in aerobic conditions from a typical experiment showing composite images generated by collapsing image stack of multiple confocal images acquired at 100x magnification. Mean γH2AX foci per nucleus (left panel) and fraction of γH2AX foci bearing nuclei (>10 foci, right panel) across (B) the entire population or (C) the EDU+, S-phase sub-population. Bars represent mean values and error bars are SEM from 2 independent experiments, each with N= ~100 nuclei per sample. NSCLCs and HBECs exposed for 24 h to an aerobic (21% O2) or hypoxic (0.1% O2) environment stained for total nuclei (DAPI), S phase nuclei (EDU, Alexa-647), Replication protein A (Alexa-488) and γH2AX (Alexa-547). (D) Representative images, acquired at 40 x magnification from a typical experiment with NSCLCs are shown. (E) S-phase nuclei with γH2AX and RPA foci were enumerated in NSCLC and HBEC cells by image analysis software. Left panel: NSCLCs, right panel: HBEC cells. Bars represent mean fraction of nuclei that are in the S-phase (EDU+) and contain >20 RPA foci, >20 γH2AX foci. Mean of means and SEM were derived from at least 2 independent experiments, each with ~1500 nuclei (N ≥ 1500) per sample.

