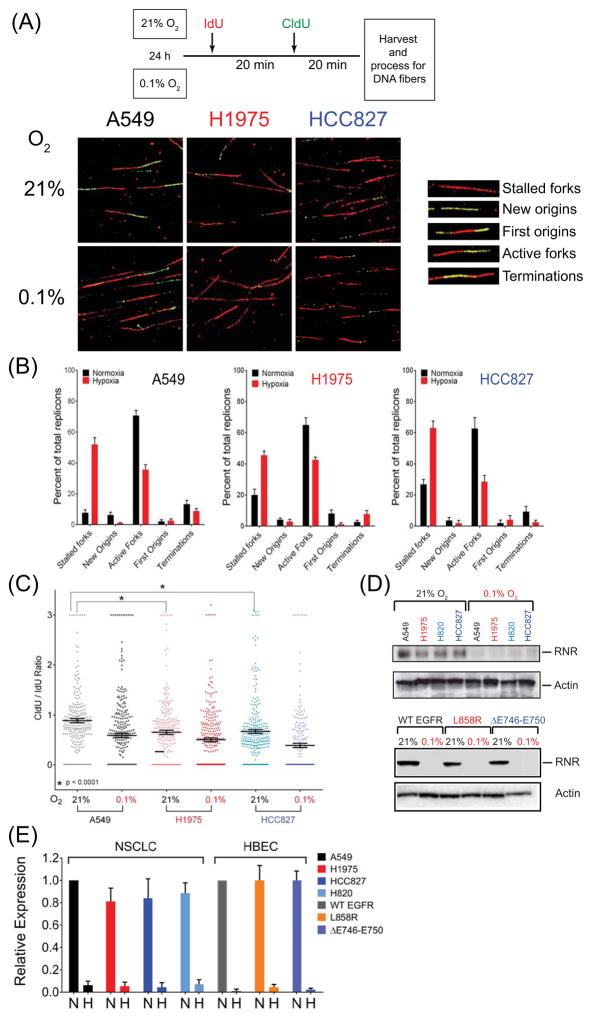
Figure 6.
Replication stress in MT-EGFR expressing cells. (A) Schematic representation of DNA fiber assay (top panel). Representative images acquired by confocal microscopy at 100x magnification (bottom panel) from NSCLC cells exposed to aerobic or hypoxic conditions showing of IdU stained (red) and CldU stained (green) fibers. Inset: replication structures identified (B) Bars, representing mean percentage of specific replication structures relative to total number of replicons, and error bars, representing SD from two independent experiments, each with at least N = 200 replicons per sample are shown. (C) Dot density plot showing frequency distribution of relative fork velocity derived from CldU/IdU ratios. Horizontal bars represent mean ratio. Asterisk represents results of a t-test analysis of between A549 and H1975 or A549 and HCC827 cells. (D) Western blot analysis: Representative blots probed for ribonucleotide reductase (RNR) and β-actin in lysates of NSCLCs (top) and HBEC (bottom) cells expressing WT, L858R or ΔE746–E750 forms of EGFR (E) Densitometric analysis of EGFR band intensities normalized to β-actin band intensities in aerobic conditions (N) and hypoxic (H) conditions. Bars represent mean RNR expression relative to A549 RNR levels for NSCLCs, or WT-EGFR expressing cells in HBEC. Error bars are SEM from 2 independent experiments.

