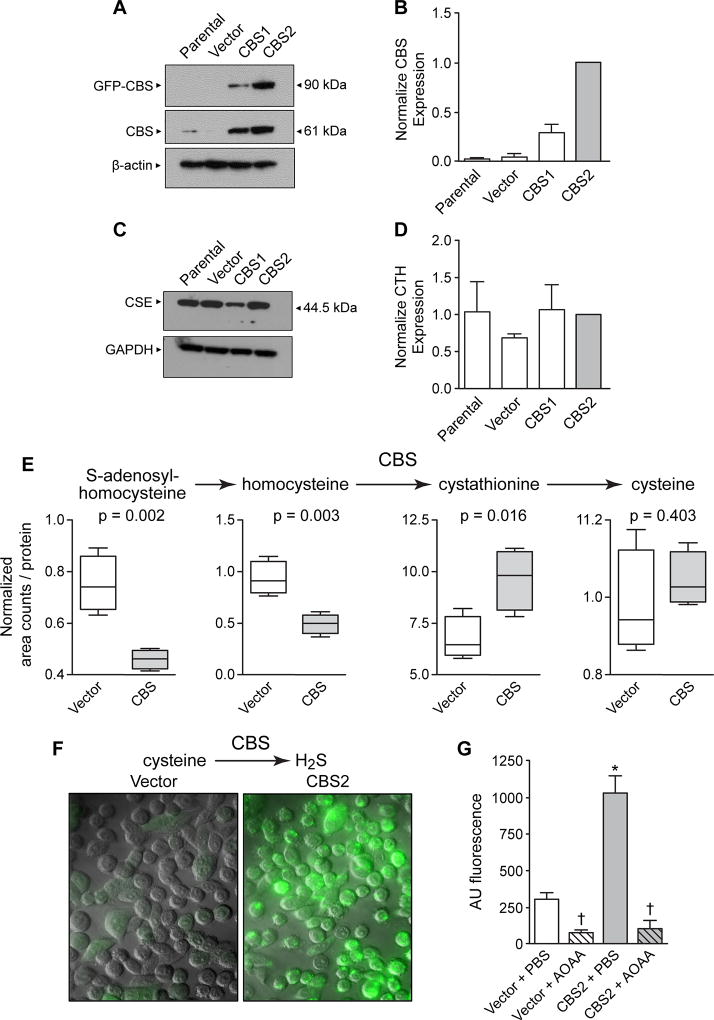
Figure 2. Characterization of CBS forced overexpression in NCM356 cell proliferation and bioenergetics.
A) Representative Western blot comparing the expression of recombinant (GFP-CBS) and endogenous CBS levels in non-transduced NCM356 cells (Parental), NCM356 cells transduced with a lentivirus containing the empty pReceiver-Lv103 GFP expression vector (Vector), or NCM356 cells transduced with the pReceiver-Lv103 GFP vector containing full-length CBS cDNA at a multiplicity of infection (MOI) of 5 (CBS1) and 15 (CBS2). The level of β-actin in each sample was assessed to determine variation in protein loading and transfer. B) Densitometry analyses of Western blots. The bar graph shows a comparison of the mean ± SEM (n=4 blots) of total CBS expressed [i.e., sum of recombinant (90 kDa band) + endogenous (61 kDa band)] in each cell line. The ratio of total CBS to β-actin was determined for each cell line for each blot and, then the ratio for each cell line was normalized to the total CBS in the CBS2 cells across blots. C) Representative Western blot and D) densitometry analyses comparing expression of CSE in the different NCM356 cell lines. The level of glyceraldehyde 3-phosphate dehydrogenase (GAPDH) was used to control for protein loading and transfer. E) CBS overexpression increased flux through the reverse transsulfuration pathway and H2S production. F) 7-Azido-4-Methylcoumarin fluorescent images show increase levels of CBS-dependent H2S. G) Quantification of 7-Azido-4-Methylcoumarin fluorescents data (error bars are mean ± S.E.M, N=3) Cell were treated with aminooxyacetic acid (AOAA) or phosphate buffered saline (PBS).

