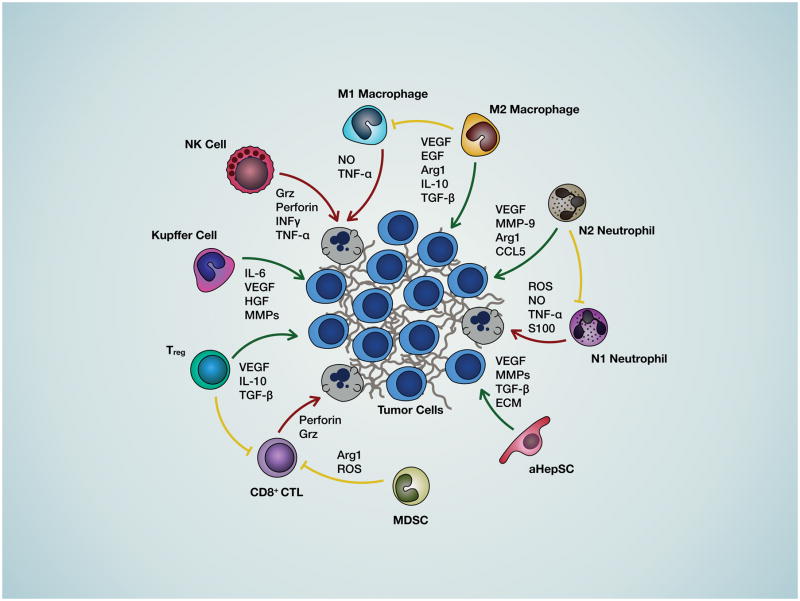
Figure 1. Cell-cell interactions in the liver microenvironment.
Shown is a diagrammatic representation of the interactions between the cancer cells the various hepatic cell types that regulate progression of metastasis and the soluble factors mediating these interactions. Green arrows represent interactions that favor metastatic expansion, red arrows represent interactions that are detrimental to cancer cell growth and blunt-end yellow arrows indicate interactions that impede anti-tumor immunity.

