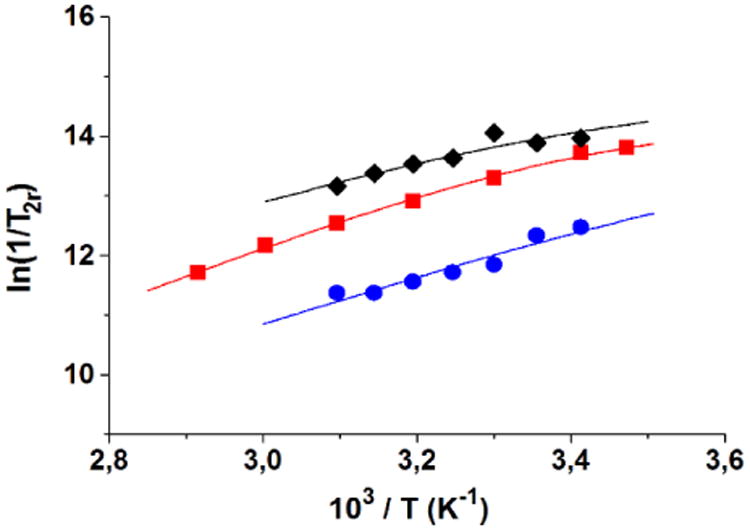
Figure 9.

Temperature dependence of reduced transverse 17O-NMR relaxation rates of 1 (
 ), 2 (
 ), and 3 (◆) at 9.4 T and pH 7.4. The solid lines are the best fits of the experimental data points.

Temperature dependence of reduced transverse 17O-NMR relaxation rates of 1 (
 ), 2 (
 ), and 3 (◆) at 9.4 T and pH 7.4. The solid lines are the best fits of the experimental data points.