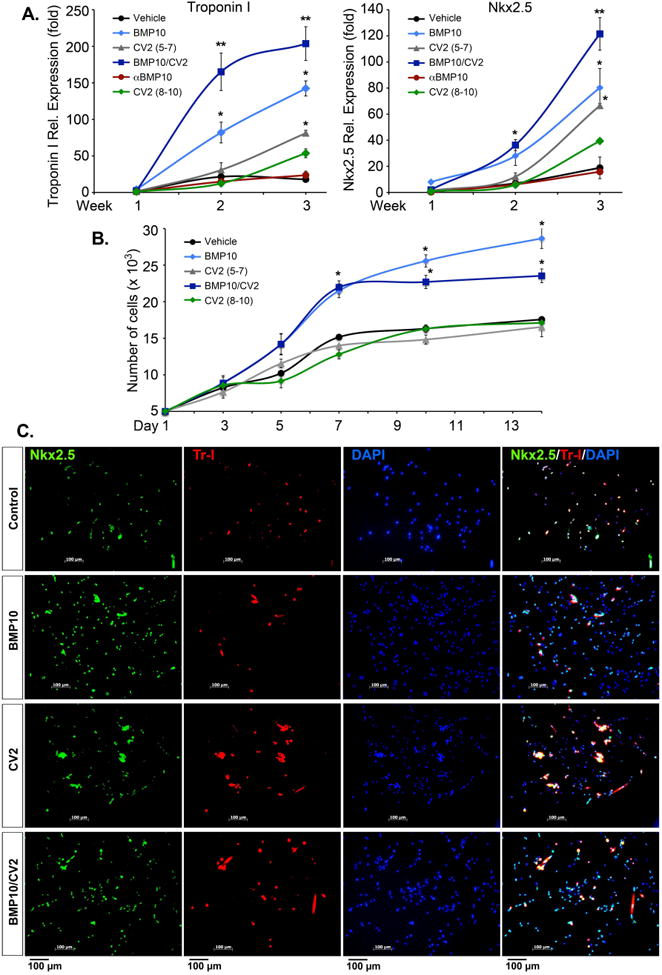
Figure 4. Cardiac marker expression after 7 days of treatment.

Mouse DFAT cells were treated with growth medium supplemented with control vehicle (day 5-7), BMP10 (25 ng/ml, day 5-7), CV2/5-7 (50 ng/ml, day 5-7), BMP10 (day 5-7) followed by CV2 (day 8-10) (BMP10/CV2), anti-BMP10 antibodies (100 ng/ml, day 5-7), or CV2/8-10 (50 ng/ml, day 8-10).
(A) Expression of Nkx2.5 and Troponin I was determined by qPCR.
(B) Proliferation was determined by direct cell counting.
(C) Localization of Nkx2.5 (green) and Troponin I (Tr, red) was determined by immunofluorescence. DAPI (blue) was used to visualize nuclei.
*<0.1, **<0.01 (n=3).
