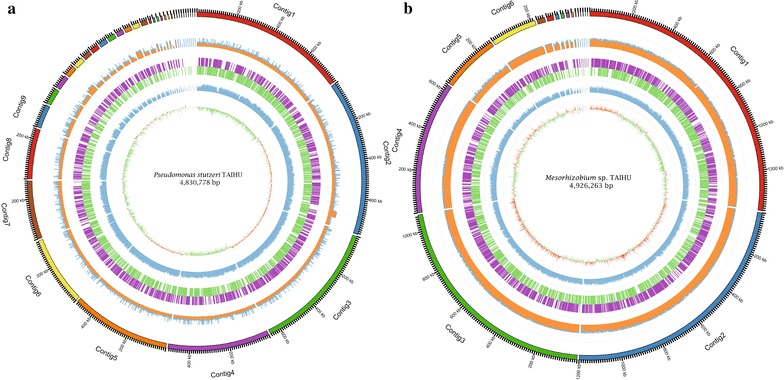
Fig. 3.

The representation of two bacteria genome sequence recovered from the coculture. The genomic characterization of Mesorhizobium sp. TAIHU (a) and Pseudomonas stutzeri TAIHU (b) is illustrated in the graphic representation generated by Circos program. The rings from outer to inner indicate the contigs, read coverage of each contigs (orange, 1 Kbp window), gene distribution on each strand (positive: purple, negative: green), GC content (blue, 1 Kbp window) and GC skew (orange above and green below zero, 1 Kbp window)
