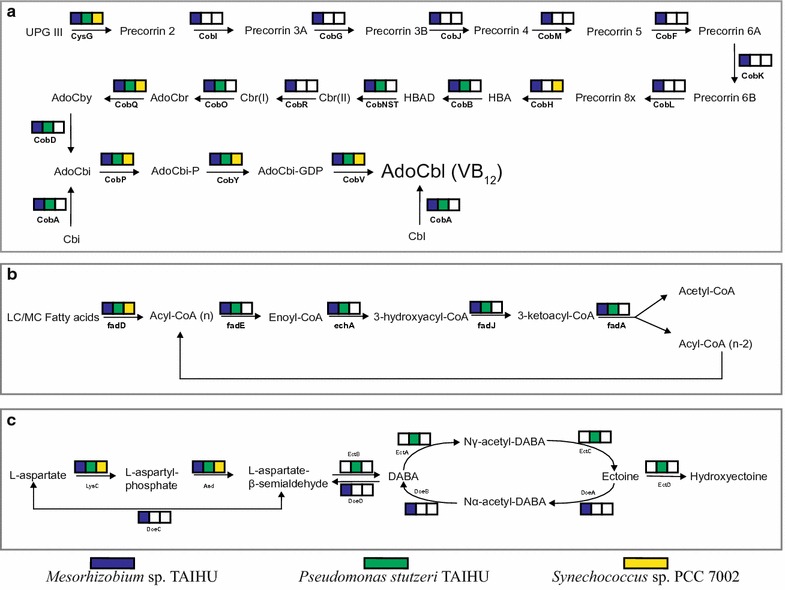
Fig. 4.

The metabolic pathway analysis for three members in the coculture. a The aerobic cobalamin biosynthesis pathway; b the β-oxidation pathway; c the ectoine biosynthesis and degration pathway. The color box indicates that the individual in the coculture carries the gene encoding the enzyme involved in the pathway, whereas an empty box (white) indicates the absence of the corresponding gene. The genes in Synechococcus sp. PCC 7002, Mesorhizobium sp. TAIHU and Pseudomonas stutzeri TAIHU are shown in yellow, blue and green, respectively. The abbreviations of the metabolites and enzymes used in the figure refer to the reference pathway (map00860, map00071, map00260) in KEGG database and the paper by Swither et al. (2012)
