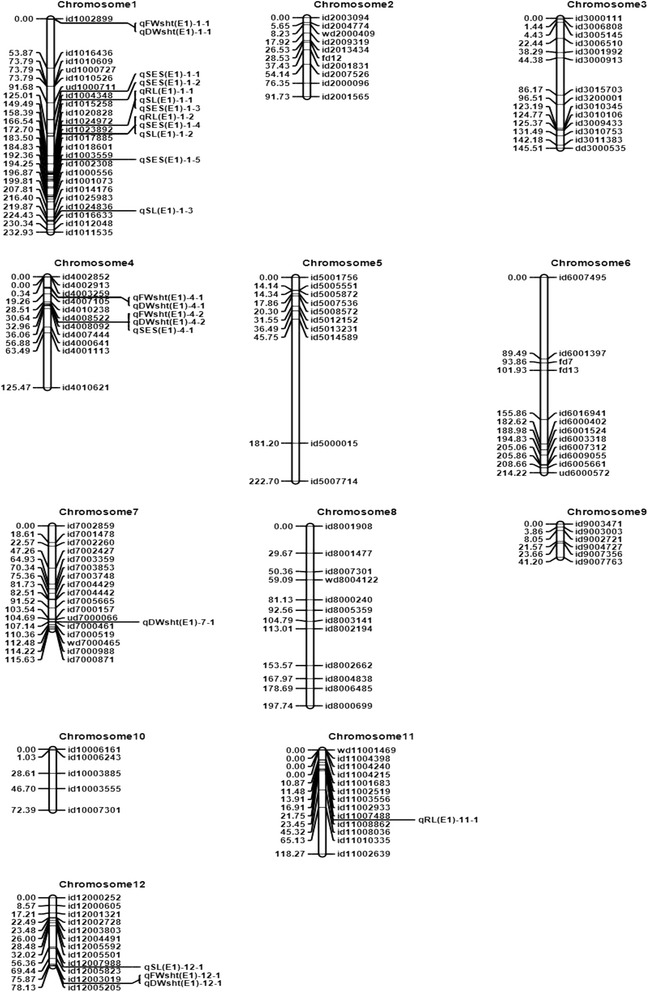
Fig. 1.

Genetic linkage maps of the 12 chromosomes constructed using ordering algorithm (RECORD) based on an IR29/Hasawi RIL population phenotyped in the phytotron at IRRI (E1). The names of the SNP markers with position are listed to the right and the approximate locations of the QTLs detected for salinity tolerance are shown to the left of the chromosomes
