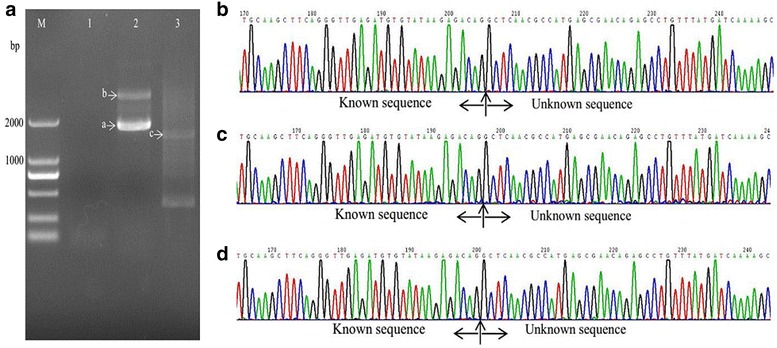
Fig. 3.

Amplification and sequencing results of the sequence flanking the Tn5 insertion site of sample 2. a Amplification product shown on an agarose gel. Lanes 1–3 show the results of steps 1–3, respectively. b Chromatograms of DNA in band a. c Chromatograms of DNA in band b. d Chromatograms of DNA in band c
