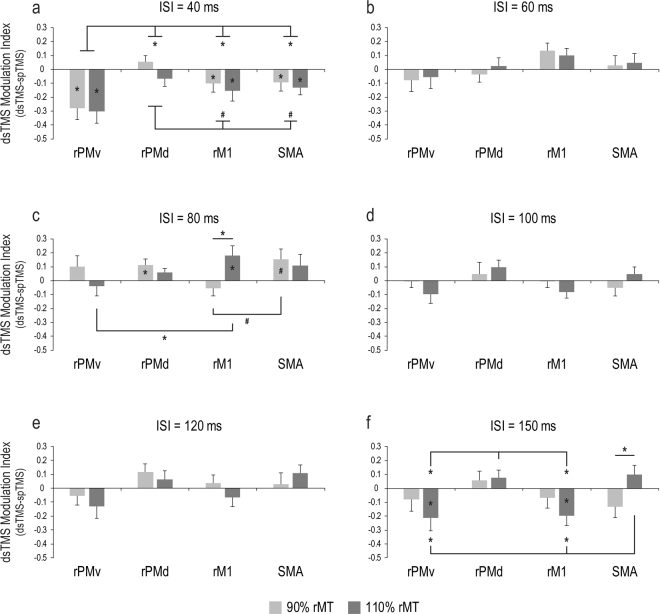
Figure 2.
Changes in lM1 excitability induced by conditioning of right motor areas. The CS site (rPMv, rPMd, rM1 and SMA) x CS intensity (90% and 110% of rMT) interaction is shown separately for each ISI (40, 60, 80, 100, 120, 150 ms) in panels (a–f). On the y-axis of each panel, the amplitude of MEPs induced by dsTMS is represented relative to MEPs induced by spTMS (dsTMS – spTMS) to normalize the data. Error bars denote S.E.M. Hash marks and asterisks indicate marginally significant and significant comparisons, respectively (see text).

