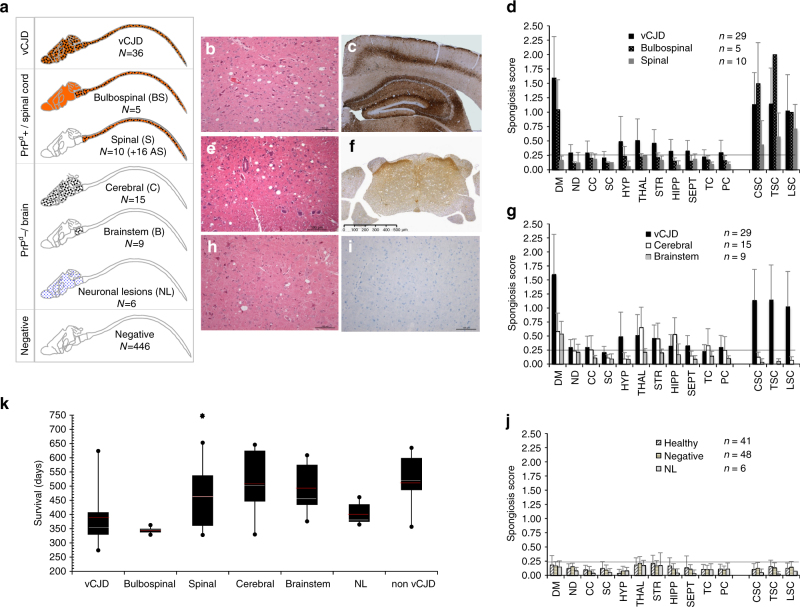
Fig. 2.
Distinct disease phenotypes observed in affected mice following intravenous exposure to vCJD-contaminated products. a Synopsis of the distribution of lesions and biochemical features in the central nervous system (CNS) of mice depending on the disease phenotype. Small dots indicate the presence of only neuronal lesions (mainly vacuolation), large dots indicate sponJPEGorm change (plus neuronal lesions) and the orange colour indicates the presence of abnormal PrPd. The respective numbers of cases are reported (N). vCJD phenotype: b classical spongiform change (hemalun–eosine, H&E stain, 200×) and c abnormal PrPd deposition (Saf-32 anti-PrP antibody, 50×). Bulbospinal phenotype (BS): d spongiform changes were limited to the brainstem and spinal cord without cerebral involvement. Spinal phenotype (S): e spongiform change was limited to part or all of the spinal cord (H&E stain, 200×) but d no obvious brain lesion. f Accumulation of PrPd in the spinal cord and dorsal roots was detected by immunohistochemistry in those 10 animals and the 16 aging spinal (AS) mice. Cerebral phenotype (C): moderate neuronal lesions and h cerebral spongiform change (H&E stain, 200×) with g a topographical distribution similar to vCJD mice (among them, 9 animals exhibited spongiform change limited to the brainstem, and were sub-grouped under the brainstem phenotype, or B). i They exhibited no accumulation of peripheral or central PrPd (Saf-32 anti-PrP antibody, 200×) that was detectable using conventional techniques (ELISA, western blot and/or immunohistochemistry). Neuronal lesions only phenotype (NL): six animals showed apoptotic neurons with vacuolation in the brain (j) without spongiform change or detectable accumulation of PrPd. Mean (+standard deviation) spongiosis profiles (d, g, j) observed for the different disease profiles. The horizontal line corresponds to the limit of significance. DM dorsal medulla, ND nucleus dentatus, CC cerebellar cortex, SC superior colliculus, HYP hypothalamus, THAL thalamus, STR striatum, HIPP hippocampus, SEPT septum, TC temporal cortex, PC parietal cortex, CSC cervical spinal cord, TSC thoracic spinal cord, LSC lumbar spinal cord. k Survival time distribution of neurologically affected mice according to their disease phenotypes. Red and white lines indicate the means and medians, respectively (the black star over spinal phenotype correspond to the 16 AS animals)

