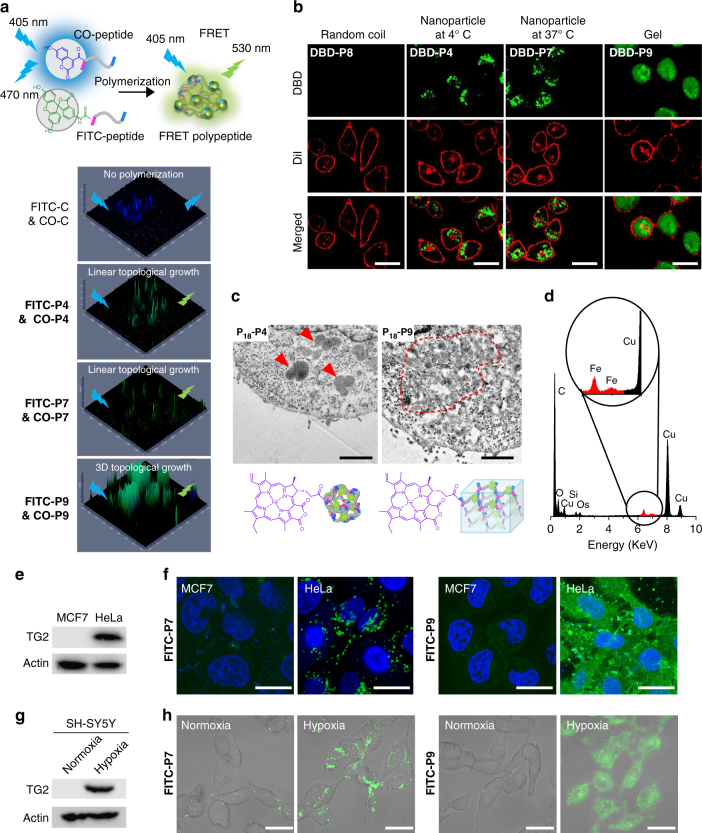
Fig. 3.
Intracellular polymerization and in situ aggregation of peptide monomers. a TG2-catalyzed intracellular polymerization of peptide monomers was monitored by fluorescent resonance energy transfer (FRET) technique. The 3D confocal images displayed the FRET effect of control, P4, P7, and P9 inside HeLa cells at 12 h-post treatment. The feed ratio of FITC-peptide (fluorescein isothiocyannate-peptide) and CO-peptide (coumarin-peptide) was 1:1. b Confocal images displayed the nanostructures (green) formed from P4 (at 4 °C) and (P7, P9) (at 37 °C). P8, P4, P7, and P9 were ELP random coil, UCST-type ELP, LCST-type ELP, and ELP gel, respectively. Cell membrane, red. Scale bar, 30 μm. c The ultrathin cell sections of HeLa cells. Fe-chelated P18 was used to identify the formed nanostructures and for contrast enhancement. Red arrows indicated P 18 -P4 3D nanoparticles; red dotted circle indicated P 18 -P9 gel. Scale bar, 1 μm. d Energy dispersive spectrometry (EDS) of the nanostructures formed from P 18 -P4. The Fe element signal (red highlighted) made the P 18 -P4 from the biological background stand out. e MCF-7 and HeLa cells were lysed. TG2 protein was examined by western blotting. f Fluorescein isothiocyannate (FITC)-labeled P7 and P9 were incubated with MCF-7 or HeLa cells for fluorescence imaging. FITC-P7 and FITC-P9, green; nucleus, blue. Scale bar, 30 μm. g The expression of TG2 protein in SH-SY5Y cells was modulated by normoxia (N) and hypoxia (H) conditions. h Peptide monomer polymerization and in situ aggregation was dependent on the expression of TG2. FITC-P7 and FITC-P9, green. Scale bar, 50 μm

