Fig. 5.
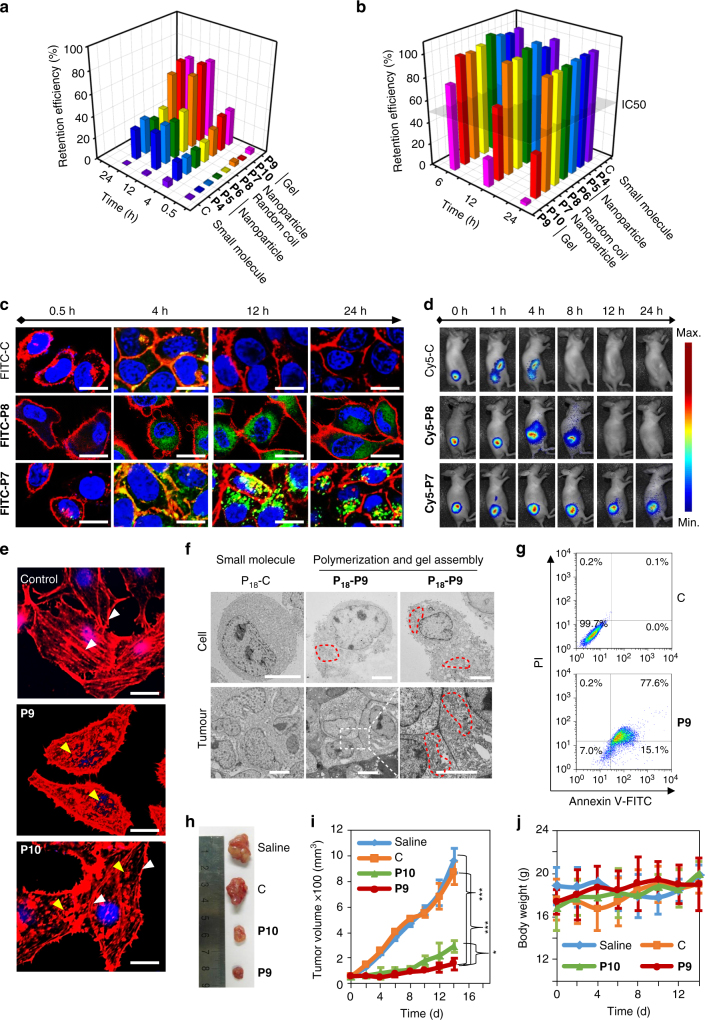
Biological functions of 1D and 3D ELP nanostructures. a Retention efficiencies of P4–P10 and the non-polymerized peptide control were measured at 0.5, 4, 12, and 24 h post peptide monomer addition. The retention efficiency was defined as the percentage of cell trapped peptides to the total feeding peptides. b Cytotoxicity of P4–P10 and the non-polymerized peptide control. Peptide monomers were fed at a concentration of 600 μΜ. c Fluorescence imaging of FITC-C, FITC-P8, and FITC-P7 in HeLa cells at 0.5, 4, 12, and 24 h post treatment. FITC-C, FITC-P8, and FITC-P7, green; cell membrane, red; nucleus, blue. Scale bar, 30 μm. d Longitudinal fluorescence imaging of Cy 5-labeled peptide C, 7, and 8 treated mice that bearing HeLa tumor xenograft. All peptides were i.v. injected at a dose of 5.0 mg kg−1. The whole-body fluorescence images were monitored longitudinally using a Maestro fluorescence imager. e The fluorescence images of cell actin filaments (stained with Rhodamine Phalloidin) after treatment with peptide control, peptide 9 and 10 for 12 h. White and yellow arrows represented intact and disrupted actin filaments, respectively. Actin filament, red; nucleus, blue. Scale bar, 10 μm. f Bio-TEM images of ultrathin sections of HeLa cells and tumor tissues at 12 h post administration of peptide C and 9. Fe-chelated P18 was labeled on all peptides to enhance the imaging contrast. Red dotted circles represented the ELP gel nanostructure. Scale bar, 5 μM. g Apoptosis was analyzed in peptide C and peptide 9 treated HeLa cells by FACS. h, Representative images of HeLa xenograft tumors collected from the mice after treatment with saline, peptide c, peptide 9, and peptide 10 at day 14. Ruler unit, cm. i The HeLa tumor growth curves after i.v. injection of saline, peptide c, peptide 9, and peptide 10 at a dose of 5 mg kg−1. Error bars indicated s.d. (n = 3). The statistical significance (*p < 0.05 and ***p < 0.001) between all pairs of components was assessed using one-way analysis of variance (ANOVA) followed by post hoc Tukey’s test. j The body weight variation of HeLa tumor-bearing mice during treatment. Error bars indicated s.d. (n = 3)

