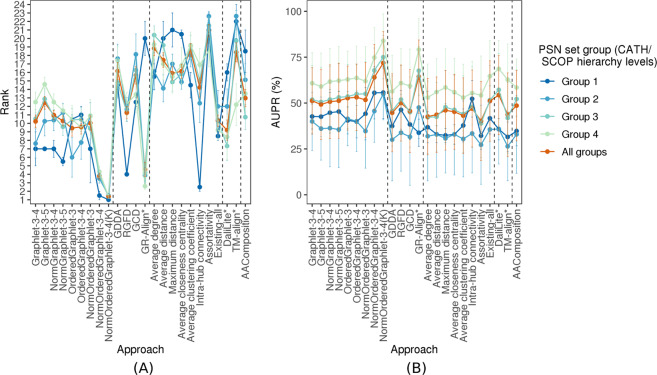
Figure 7.
The PSN set group-specific performance comparison of the 24 considered approaches, averaged over all PSN sets in the given PSN set group. The figure can be interpreted in the same way as Fig. 5, except that here results are shown only with respect to AUPR but not AUROC. The trends are very similar with respect to AUROC as well (Supplementary Fig. S3). These results are for the best PSN construction strategy. Equivalent results for each of the PSN construction strategies (which are qualitatively similar) are shown in Supplementary Figs S4–S7.

