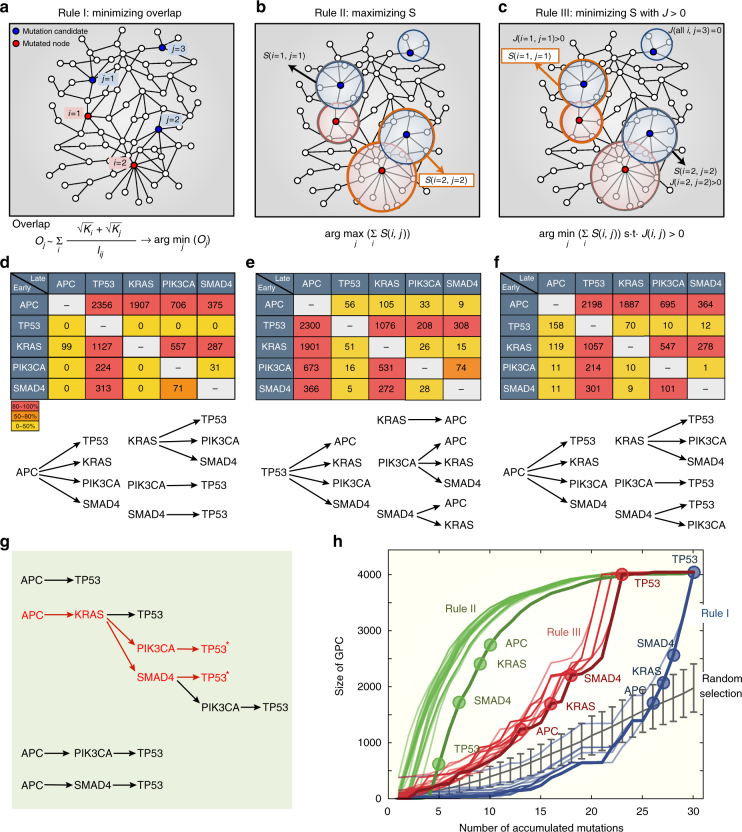
Fig. 5.
Percolation transition of a GPC. a A mutation selection rule for minimizing the degree of overlap between somatic mutations (see Methods and Supplementary Fig. 16 for details). The rule is to select a mutation candidate j that minimizes the sum of overlap measures between j and all the previously mutated ones. b A mutation selection rule for maximizing the size of connected modules. The rule is to select a mutation candidate j that maximize the sum of S(i, j) for all the previously mutated ones. For instance, node j = 2 will be selected as the next mutation because S(i = 2, j = 2) is larger than S(i = 1, j = 1) in the figure. c A mutation selection rule for minimizing the size of connected modules with the constraint that two modules of j and a mutated one i should overlap, J(i, j) > 0. For instance, node j = 1 will be selected as the next mutation because S(i = 1, j = 1) is smaller than S(i = 2, j = 2) in the figure. By applying the rules to the mutation profiles of individual patients, we obtained totally 3834 mutation sequences according to which mutation was selected as a seed. By investigating the order of a pair of driver mutations in the resulting mutation sequences, we constructed a matrix showing the number of mutation sequences that one driver mutation in a row occurs earlier than the other driver mutation in a column according to the first d, second e, and the last f rules. The bottom figures represent possible orders of driver mutation pairs with significant percentages (80–100%) in the respective rules. g All available mutation sequences from APC to TP53 from the result of f. Red asterisks indicate the most commonly observed sequences of driver mutations in colorectal cancers. h The changes in the size of the GPC along with the accumulation of somatic mutations according to the rules, as an example, for a patient who has four driver mutations, APC, KRAS, SMAD4, and TP53, among 29 somatic mutations (see Methods for details). Driver mutations are denoted by circles at the corresponding order of occurrence of mutations in each rule. For comparison of the rules and the random expectation, we generated 100 mutation sequences among 29 randomly selected genes

