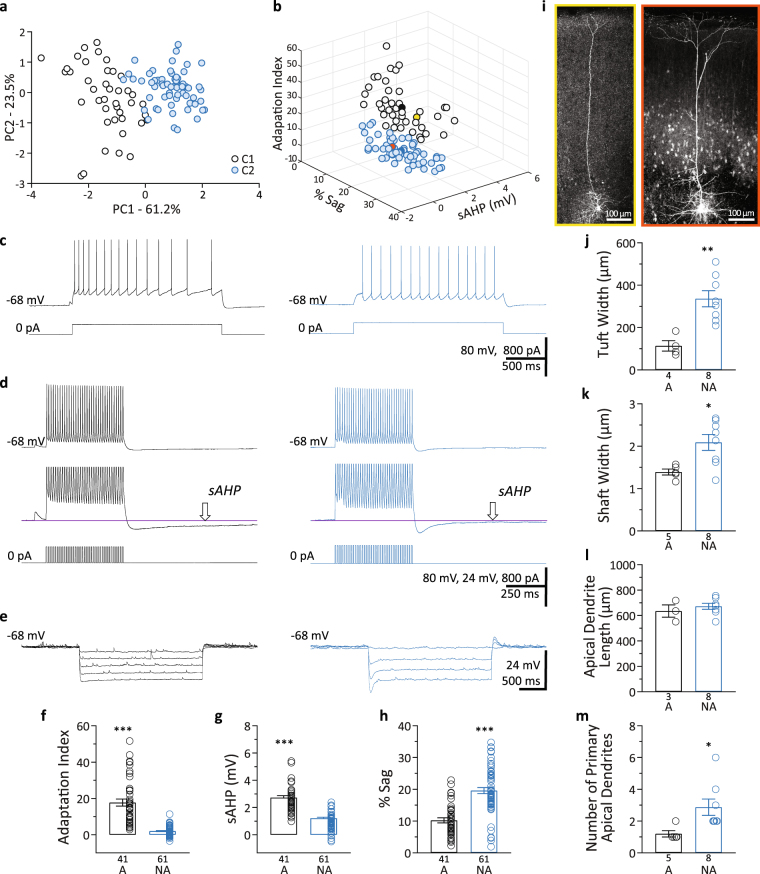
Figure 1.
Identification of adapting and non-adapting L5 pyramidal neurons. (a) PCA score-plot for the first two principal components for each L5 pyramidal neuron showing the cell clusters detected. Cluster 1 (C1) corresponds to the adapting neurons and C2 corresponds to the non-adapting neurons. (b) 3D scatter plot of the intrinsic properties, adaptation index, % sag, and sAHP, used for the clustering analysis. White circles, adapting neurons; blue circles, non-adapting neurons; solid black and blue circles correspond to the centroids of the two clusters; yellow circle, adapting cell illustrated in panel i-left; orange circle, non-adapting cell illustrated in panel i-right. (c) Examples of action potential trains (upper traces) fired in response to intracellular current injection (lower traces). Left upper trace shows considerable spike frequency adaptation (Adaptation Index = 22.1). Right upper trace shows minimal adaptation (Adaptation Index = 0.5). (d) Upper traces, examples of sAHP from an adapting neuron (left) and a non-adapting neuron (right). Middle traces, Y-axis expansion of upper traces. The amplitude of the sAHP is measured at the arrow. Lower traces, intracellular current injection. (e) Examples of membrane potential sag in response to hyperpolarizing current steps from an adapting (left) and a non-adapting (right) neuron. Larger current steps were used in (e) in the neuron on the right. All representative traces belong to the same adapting (left traces) or non-adapting (right traces) neuron (c–e). (f–h) Summary of intrinsic properties for the adapting (A) and non-adapting (NA) groups of L5 pyramidal neurons. (f) Spike frequency adaptation index; (g) sAHP; and (h) %sag. (i–m) Morphological analysis of adapting and non-adapting L5 pyramidal neurons in S1BF. (i) Representative microphotographs of biocytin-labeled neurons. Left/yellow border, adapting neuron; Right/orange border, non-adapting neuron. (j) Tuft width; (k) Shaft width; (l) Length of primary apical dendrites; (m) Number of primary apical dendrites. Data presented as mean ± standard error. *p < 0.05; **p < 0.01; ***p < 0.001.

